On January 1, 2026, approximately 700 hospitals across the United States began mandatory participation in the Centers for Medicare & Medicaid Services’ (CMS’) Transforming Episode Accountability Model (TEAM). TEAM is CMS’ new bundled payment model where participants will be taking on financial risk for the costs and quality outcomes of Medicare fee-for-service (FFS) beneficiaries undergoing five surgical procedures:
- Major bowel procedures
- Coronary artery bypass grafts
- Lower extremity joint replacements
- Surgical hip and femur fractures
- Spinal fusions
TEAM episode costs include the procedure (anchor) costs (both facility and professional), along with most costs incurred in the 30 days after discharge, including those for skilled nursing facility (SNF) stays.
Why should SNFs consider TEAM an engagement opportunity with hospitals?
1. TEAM participation is broad and mandatory.
TEAM is a mandatory CMS model with a wide geographic scope, requiring participation from hospitals with varying levels of experience in bundled payment programs in about 25% of the core-based statistical areas (CBSAs) across the country. Across the hospitals selected to participate in TEAM, there are roughly 198,000 TEAM surgical procedures annually, with about 114,000 (58%) occurring in the inpatient setting. See Figure 1 for the estimated TEAM inpatient volume by county.
Figure 1: Estimated TEAM inpatient annual volume by county

2. A substantial portion of intervenable TEAM episode spend occurs in the 30-day post-anchor period.
Nationally, post-anchor spend for inpatient TEAM episodes accounts for roughly 34% of total episode costs, and post-anchor spend for outpatient TEAM episodes accounts for approximately 21% of total episode costs. Specifically, the distribution of post-anchor spend after discharge from inpatient TEAM episodes is approximately:
- 39% on SNFs (including swing beds for SNF care)
- 33% on inpatient rehabilitation facilities (IRFs)
- 11% on unplanned readmissions
- 6% on home health (HH) care
- 11% on other services
3. There is substantial variation in post-anchor utilization and spend across regions and among TEAM participants.
The financial methodology in TEAM is built around the average episode spending across all hospitals, both mandated and non-mandated for TEAM participation, in each of the U.S. Census division regions. Therefore, some TEAM participants may already be managing their post-anchor spending better than their peers, while others will be looking to change their care patterns to achieve savings or avoid losses in the model. Based on the Medicare FFS 100% Research Identifiable Files (RIFs), Figure 2 shows variation in post-anchor utilization after inpatient TEAM episodes by region, while Figure 3 shows variation in post-anchor utilization for five hospitals in the Pacific region.
With an estimated 85% of TEAM episodes expected to be orthopedic procedures, the use of IRF and SNF become key targets for care pattern changes as participants look to shift utilization from (1) higher to lower acuity care providers and (2) inefficient to efficient care providers. For example, at the national level, shifting a patient from an IRF or swing bed to a SNF stay saves an estimated $12,000 to $24,000 per inpatient episode, respectively.
Figure 2: Post-anchor utilization for inpatient TEAM episodes by region

Figure 3: Post-anchor utilization for inpatient TEAM episodes by hospital
| Region | Hospital | Estimated Annual TEAM Volume |
Readmit Rate |
IRF Utilization |
SNF Utilization |
HH Utilization |
|---|---|---|---|---|---|---|
| Pacific | Hospital 1 | 744 | 3% | 9% | 15% | 73% |
| Pacific | Hospital 2 | 176 | 6% | 12% | 31% | 24% |
| Pacific | Hospital 3 | 263 | 7% | 7% | 16% | 47% |
| Pacific | Hospital 4 | 352 | 5% | 14% | 0% | 11% |
| Pacific | Hospital 5 | 636 | 4% | 6% | 13% | 55% |
4. There is substantial variation in post-anchor provider performance, particularly SNF average length of stay (LOS) and readmission rates.
TEAM participants looking to change their care patterns will be interested in evaluating the performance of their post-anchor providers, including SNFs, to determine which providers are most efficient and cost effective. Many participants will be looking to partner with well-performing providers that can demonstrate that they provide both high quality of care and potential savings opportunities for TEAM participants. For SNF providers, this includes lower average LOS and readmission rates.
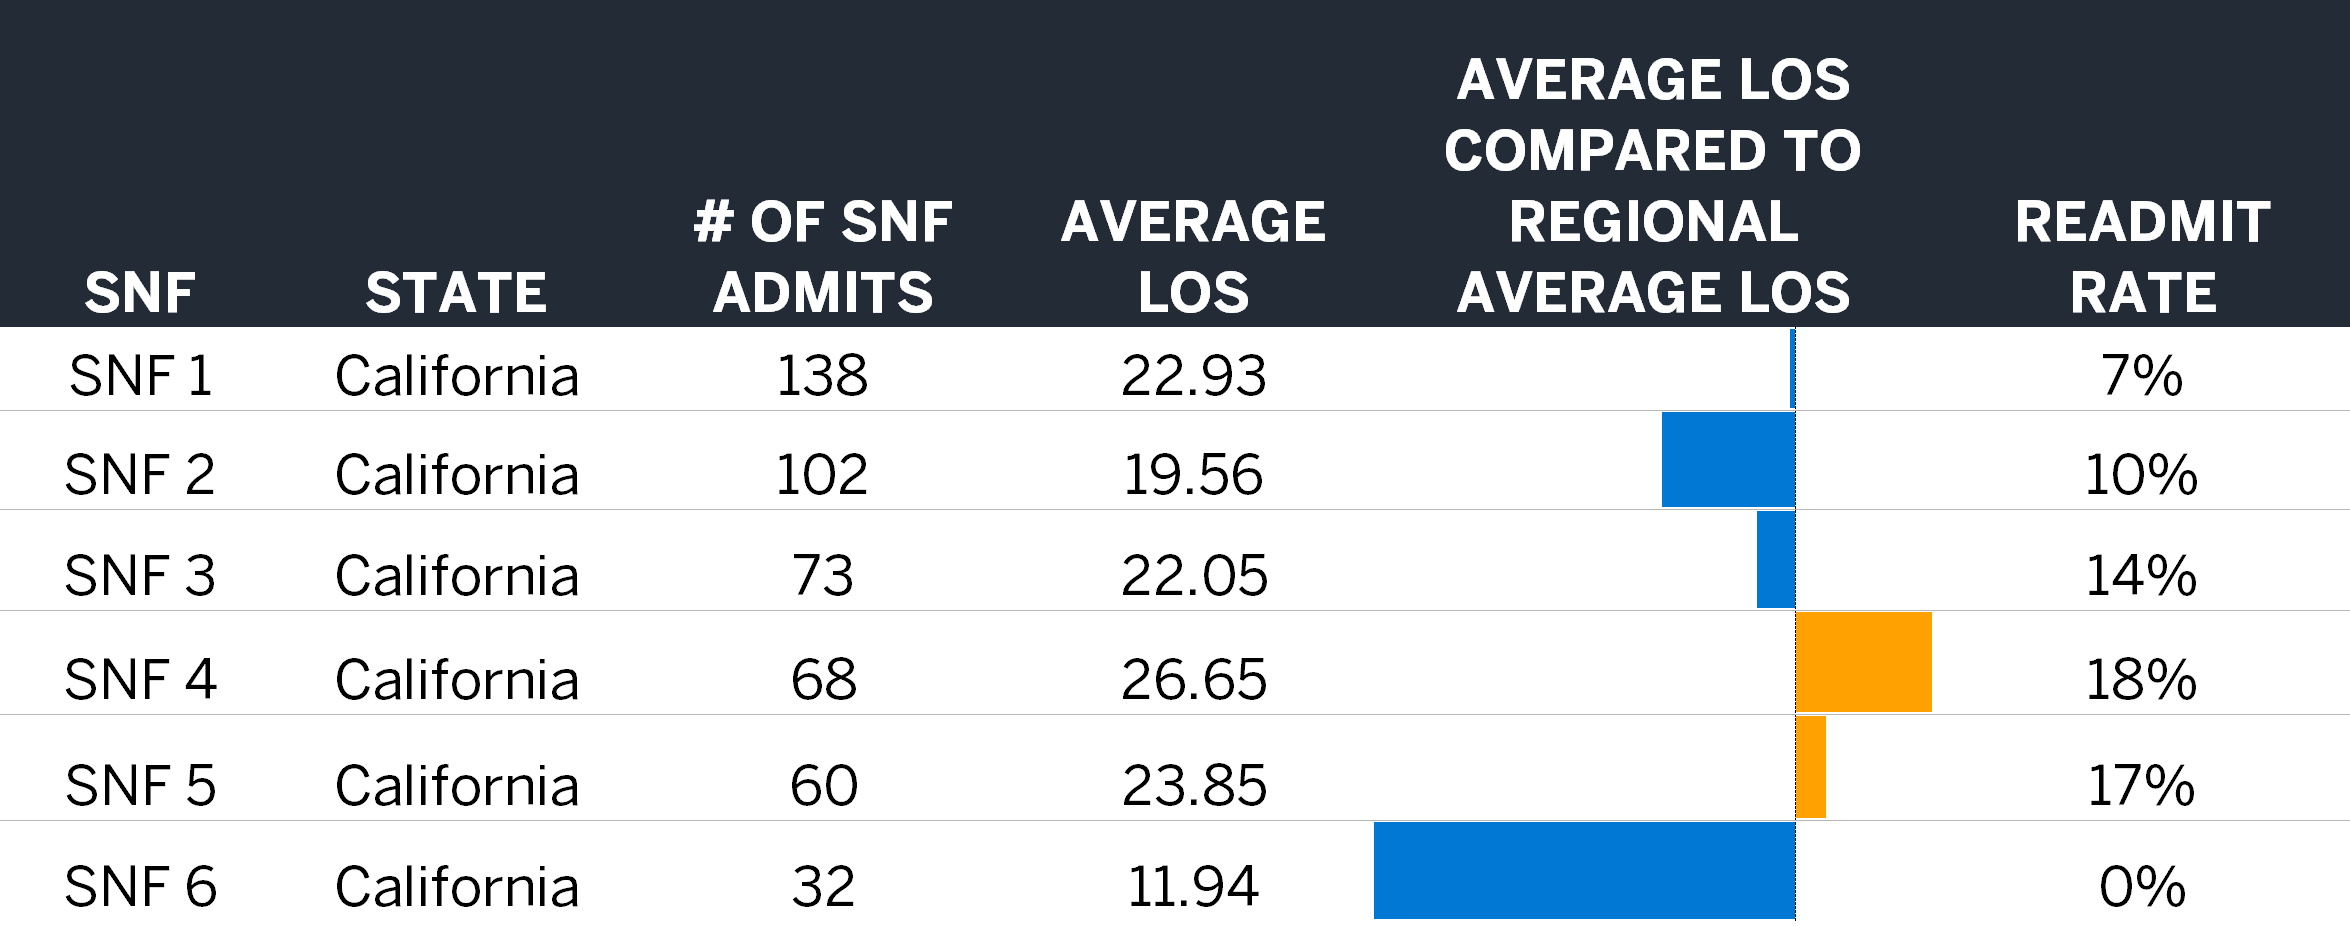
Because SNF standardized payments are based on a per-diem calculation, reducing SNF average LOS results in cost savings. Although individual episode SNF LOS will vary based on the surgical procedure performed as well as patient complexity, the practice patterns of individual SNFs drive much of the variation in average LOS.1,2 In addition to reducing SNF average LOS, preventing readmissions are an opportunity for both cost savings (the average readmission in a TEAM episode costs roughly $14,000) and quality outcomes in TEAM. Using the 2024 Medicare FFS 100% RIFs, we analyzed the average LOS and readmission rates of all SNFs nationwide and developed a model that allows for SNF comparisons for TEAM episodes. Figure 4 shows average LOS and readmission performance among six SNFs in California.
Figure 4: SNF performance for TEAM episodes
How can SNFs develop a strategy and value proposition for engaging with TEAM hospitals?
1. Identify the TEAM-mandated participation in their service area, focusing on those with improvement opportunities.
SNFs located in areas with meaningful TEAM-mandated participation have several options for hospital engagement. Understanding the number of TEAM participants, the volume of inpatient episodes, and the participants with a need to improve their performance will help SNFs build their value proposition to TEAM participants. Figure 5 displays the estimated TEAM volumes by region, while Figure 6 illustrates a TEAM participant analysis for a SNF’s area of service, based on the 2024 Medicare FFS 100% RIFs.
Figure 5: Estimated annual TEAM episode counts by region
| Region | Estimated Annual TEAM Episode Count |
% Inpatient |
|---|---|---|
| Middle Atlantic | 46,800 | 60% |
| South Atlantic | 33,700 | 53% |
| Pacific | 28,900 | 61% |
| New England | 23,700 | 62% |
| East South Central | 17,400 | 58% |
| Mountain | 14,200 | 50% |
| West South Central | 12,800 | 61% |
| West North Central | 12,200 | 58% |
| East North Central | 8,100 | 46% |
Figure 6: Estimated TEAM performance by hospital
| Hospital | County | Estimated Episode Count |
Estimated TEAM Performance |
|---|---|---|---|
| Hospital 1 | County 1 | 239 | ($1M)–($500K) |
| Hospital 2 | County 1 | 169 | ($250K)–$0 |
| Hospital 3 | County 1 | 349 | ($500K)–($250K) |
| Hospital 4 | County 1 | 342 | $0–$250K |
| Hospital 5 | County 1 | 29 | ($500K)–($250K) |
2. Identify participants with opportunities to shift care from IRFs to SNFs.
SNFs in regions with high IRF utilization are well positioned to build their value proposition on being more cost effective than IRFs. Understanding the volume and cost of episodes with IRF utilization can help SNFs build a case around why TEAM participants should be shifting cases from IRFs to their SNFs from a cost savings perspective.
3. Identify and demonstrate more efficient average LOS and readmission rates compared to SNF peers.
SNFs that can develop a value proposition demonstrating better average LOS and readmission performance compared to their peers for inpatient TEAM episodes may be able to influence steerage of more cases to their SNFs. Understanding how their LOS and readmission rates compare to their peers in the region can support a SNF’s referral discussions.
Closing thoughts: How SNFs can help hospitals achieve savings through TEAM
TEAM will have a substantial impact on the hospitals mandated for participation, but also on the downstream providers that provide post-procedure care as hospitals look to change their care patterns in order to succeed (or minimize losses) in the model. Providers, including SNFs, can position themselves as valuable and effective partners in achieving model savings by identifying key TEAM hospital stakeholders and creating value propositions that speak to where they can help participants achieve savings opportunities.
Milliman has extensive subject matter expertise and data-driven tools to help SNFs develop value propositions for TEAM participants. For more information, contact your Milliman consultant.
1 Fitch, K., Broulette, J., Ellenberg, P., & Jackson, J. (September 13, 2024). Variation in skilled nursing facility practice patterns: Opportunities exist for more efficient management. Retrieved January 22, 2026, from https://www.milliman.com/en/insight/variation-skilled-nursing-facility-practice-management.
2 Center for Medicare Advocacy. (June 6, 2019). Nursing home study finds discharges linked to Medicare copayments. Retrieved January 22, 2026, from https://medicareadvocacy.org/nursing-home-study-finds-discharges-linked-to-medicare-copayments/.