This briefing note summarises the year-end 2025 Solvency and Financial Condition Reports (SFCRs) of selected non-life insurers based in Luxembourg.1 It includes an analysis of key information disclosed in the Quantitative Reporting Templates (QRTs) published with the SFCRs. We selected a sample of 10 Luxembourgish non-life insurance entities based on the volume of gross written premiums (GWP) in 2025.
Summary of developments
The Luxembourg non-life insurance market remained fundamentally resilient during 2025. Market activity experienced a minor slowdown, with non-life insurance premium income reaching €29.2 billion in 2025, a decrease of 2.7% compared with 2024.2 International non-life business remained the main driver, with ACA (Association of Luxembourg insurers and reinsurers) member companies reporting €16.2 billion of international non-life premiums, an increase of 1.6% compared with 2024.3
The aggregate solvency ratio for the companies included in our sample was 212% at year-end 2025, a decrease of 21% compared to 2024. However, Luxembourgish non-life insurers remain well capitalised and continue to hold a significant capital buffer in excess of the Solvency Capital Requirement (SCR) of 100%.
European insurance consolidation remained an important theme, as it affects insurers activity in Luxembourg. Notably, Allianz Direct’s agreement to acquire Swiss Re’s iptiQ EMEA property and casualty (P&C) business,4 the completion of Helvetia–Baloise merge to form Helvetia Baloise Holding Ltd.5 and the rebranding and renaming of RSA Europe to Intact Insurance (Europe) S.A.6
From a regulatory perspective, 2025 was also the first year in which insurers had to operate under the EU Digital Operational Resilience Act framework. The CAA issued Circular Letter 25/17 on the Digital Operations Resilience Act (DORA) incident reporting in January 2025, making information and communication technology (ICT) risk, outsourcing, cyber resilience and incident management more central supervisory topics for Luxembourg insurers.
Analysis of premiums
The 10 selected insurers account for €15.9 billion, representing about 50%8,9 of the total GWP for non-life insurers based in Luxembourg. The insurers selected are outlined in Figure 1.
GWP increased in 2025 for most of the selected insurers, resulting in an overall growth of 3% compared with 2024. Two insurers report a decline in GWP: Swiss Re Int. and Tokio Marine. Swiss Re’s decline in GWP is primarily due to lower property business volumes, the transfer of certain renewals to other Swiss Re group entities, the run-off of its aviation portfolio and adverse foreign-exchange movements.10 Tokio Marine Europe’s overall GWP increased by 3.4% in US-dollar terms (reporting currency), i.e., from $663.6 million to $685.9 million. However, when expressed in euro currency, a decrease is observed due to the depreciation of the reporting currency (USD) relative to the prior year, i.e., 0.9626 in 2024 versus 0.8511 in 2025.11
It is noticeable that the three largest insurers, which account for about 38% of the total market, are significantly larger compared to the other insurers in terms of GWPs, ranging from €3.0 billion to €4.7 billion in 2025. The other seven selected insurers have significantly lower GWPs.
Figure 1: Reported total GWP12 2025 versus 2024 and as percentage of the total Luxembourg market (figure in € millions)
| RANK | INSURER | GWP 2025 | GWP 2025 | CHANGE | MARKET SHARE (%) |
|---|---|---|---|---|---|
| 1 | AIG | 4,728 | 4,608 | +120 | 16% |
| 2 | Liberty Mutual | 3,238 | 3,005 | +233 | 11% |
| 3 | Swiss Re Int | 2,978 | 3,163 | -184 | 10% |
| 4 | FM Insurance | 1,390 | 1,254 | +136 | 5% |
| 5 | HISCOX | 637 | 614 | +23 | 2% |
| 6 | Foyer | 631 | 600 | +31 | 2% |
| 7 | Aioi | 612 | 529 | +84 | 2% |
| 8 | Tokio Marine | 585 | 638 | -53 | 2% |
| 9 | SI Insurance | 582 | 466 | +116 | 2% |
| 10 | Intact * | 489 | 469 | +20 | 2% |
* RSA has been rebranded and renamed to Intact Insurance (Europe) S.A.13
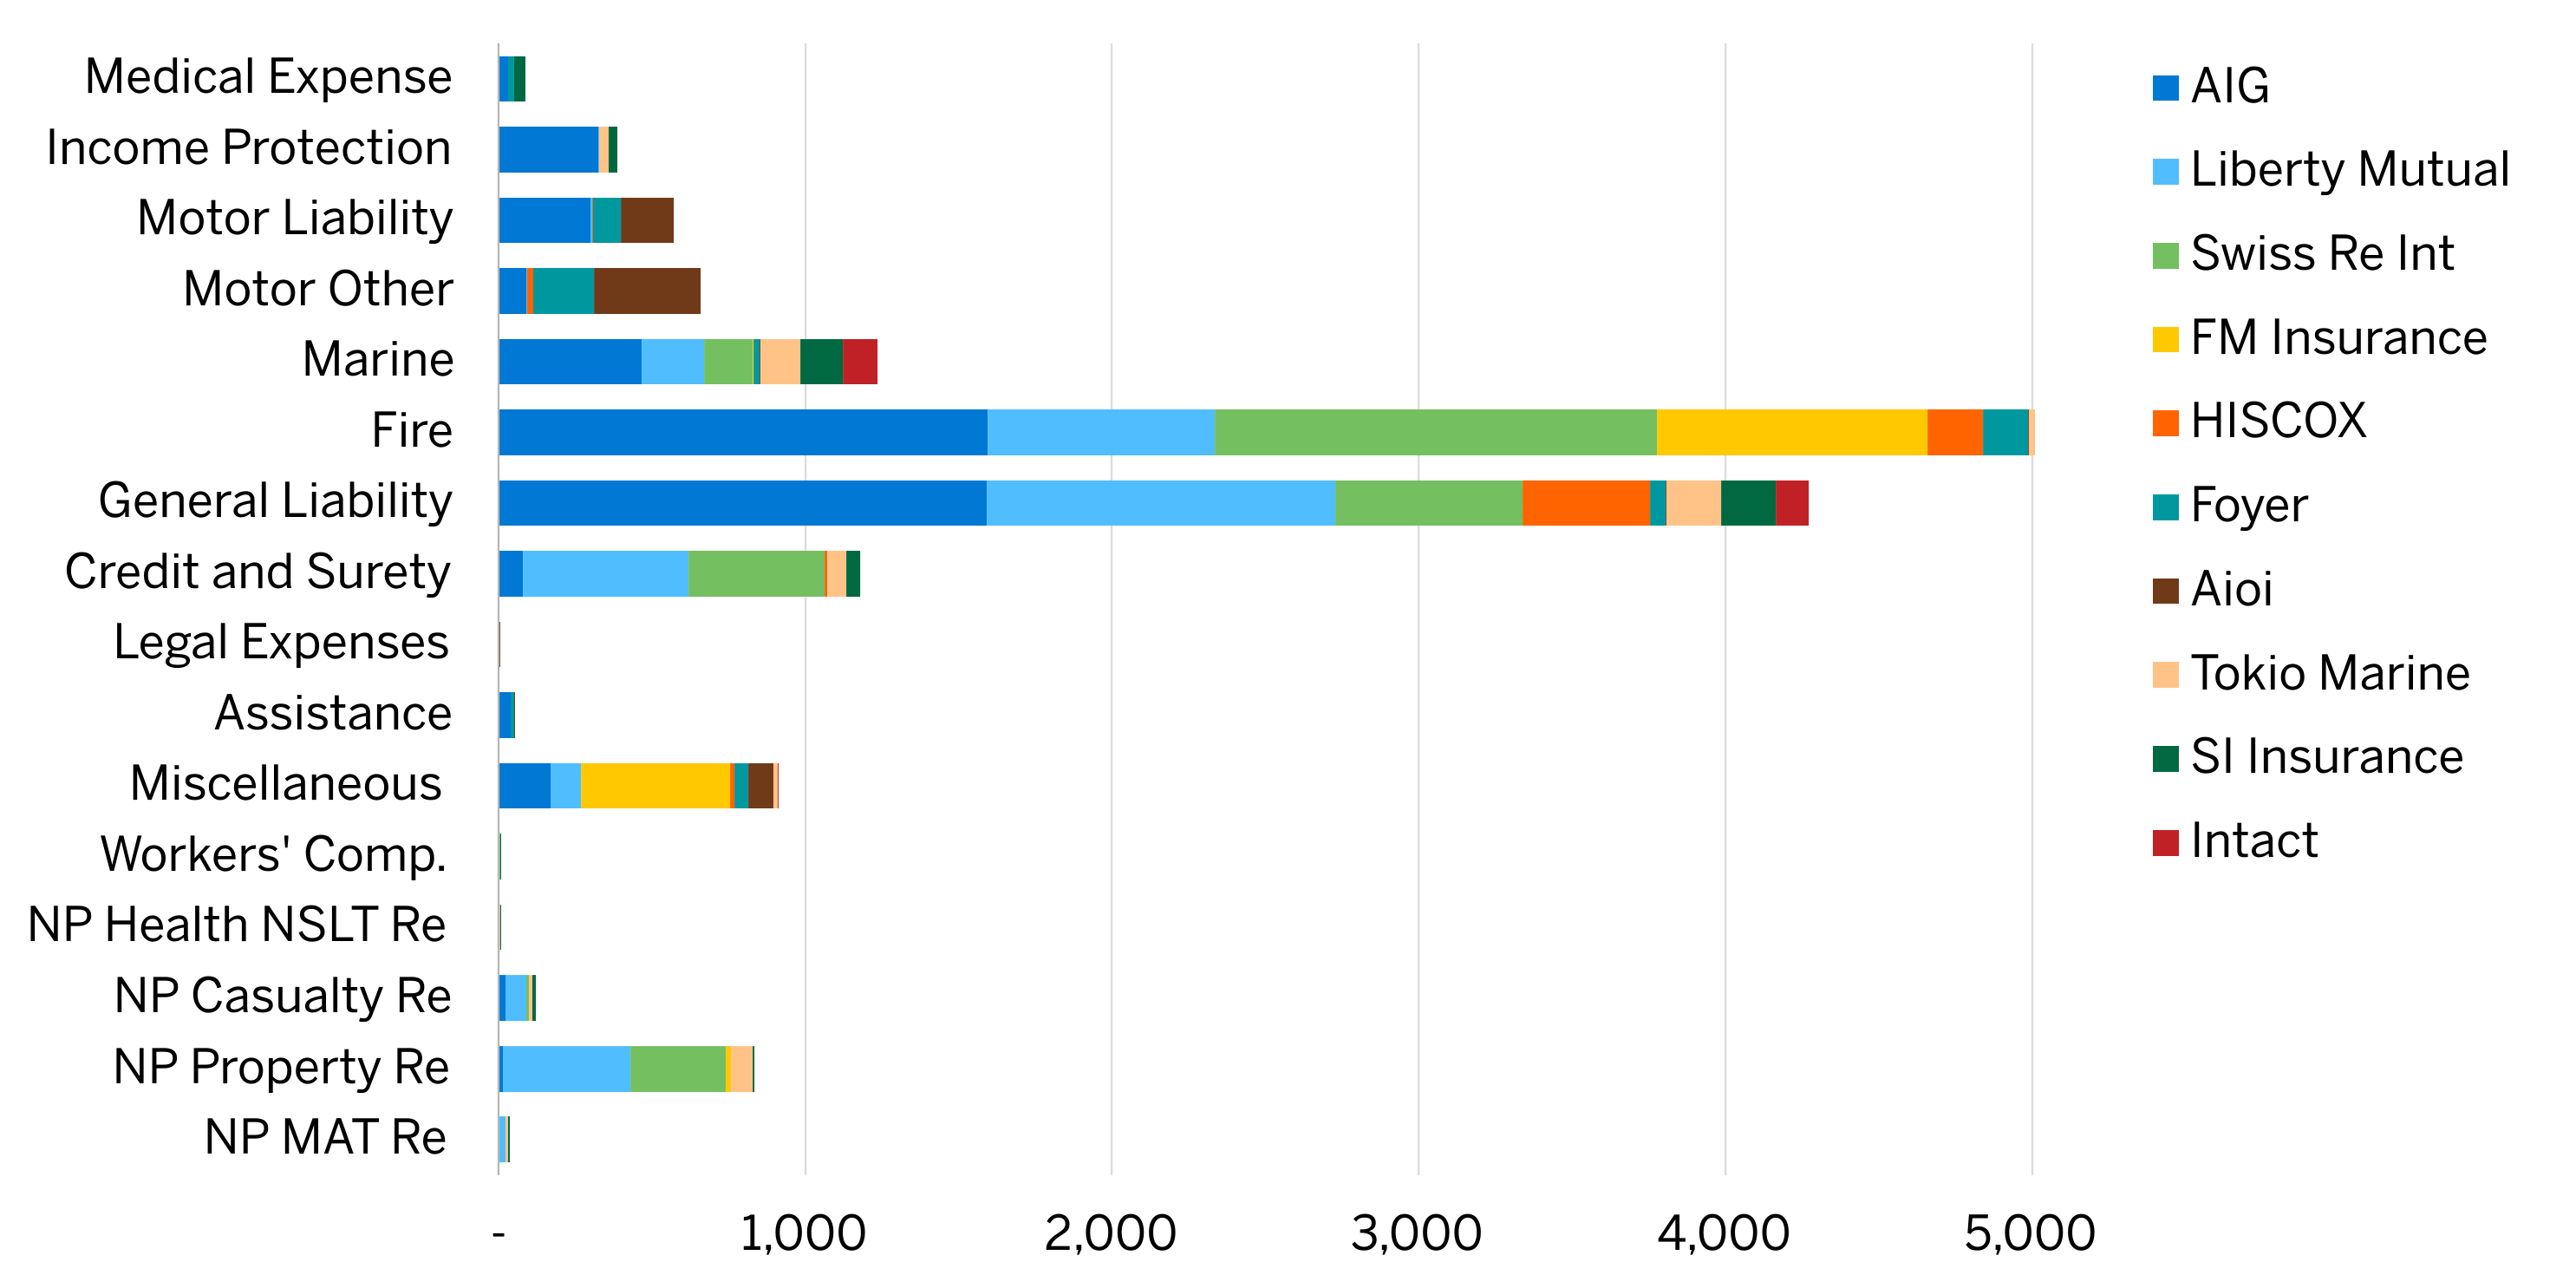
The largest lines of business for the selected insurers are fire and general liability, representing about 62% on non-life premium written in 2025, followed by marine and credit & surety, with both around 7%.
The three largest insurers (AIG, Liberty Mutual and Swiss Re Int.) exhibit a distinct business profile, writing mainly fire and general liability, as well as marine and credit & surety.
Figure 2: GWPs per line of business (figure in € millions)14
Combined ratio
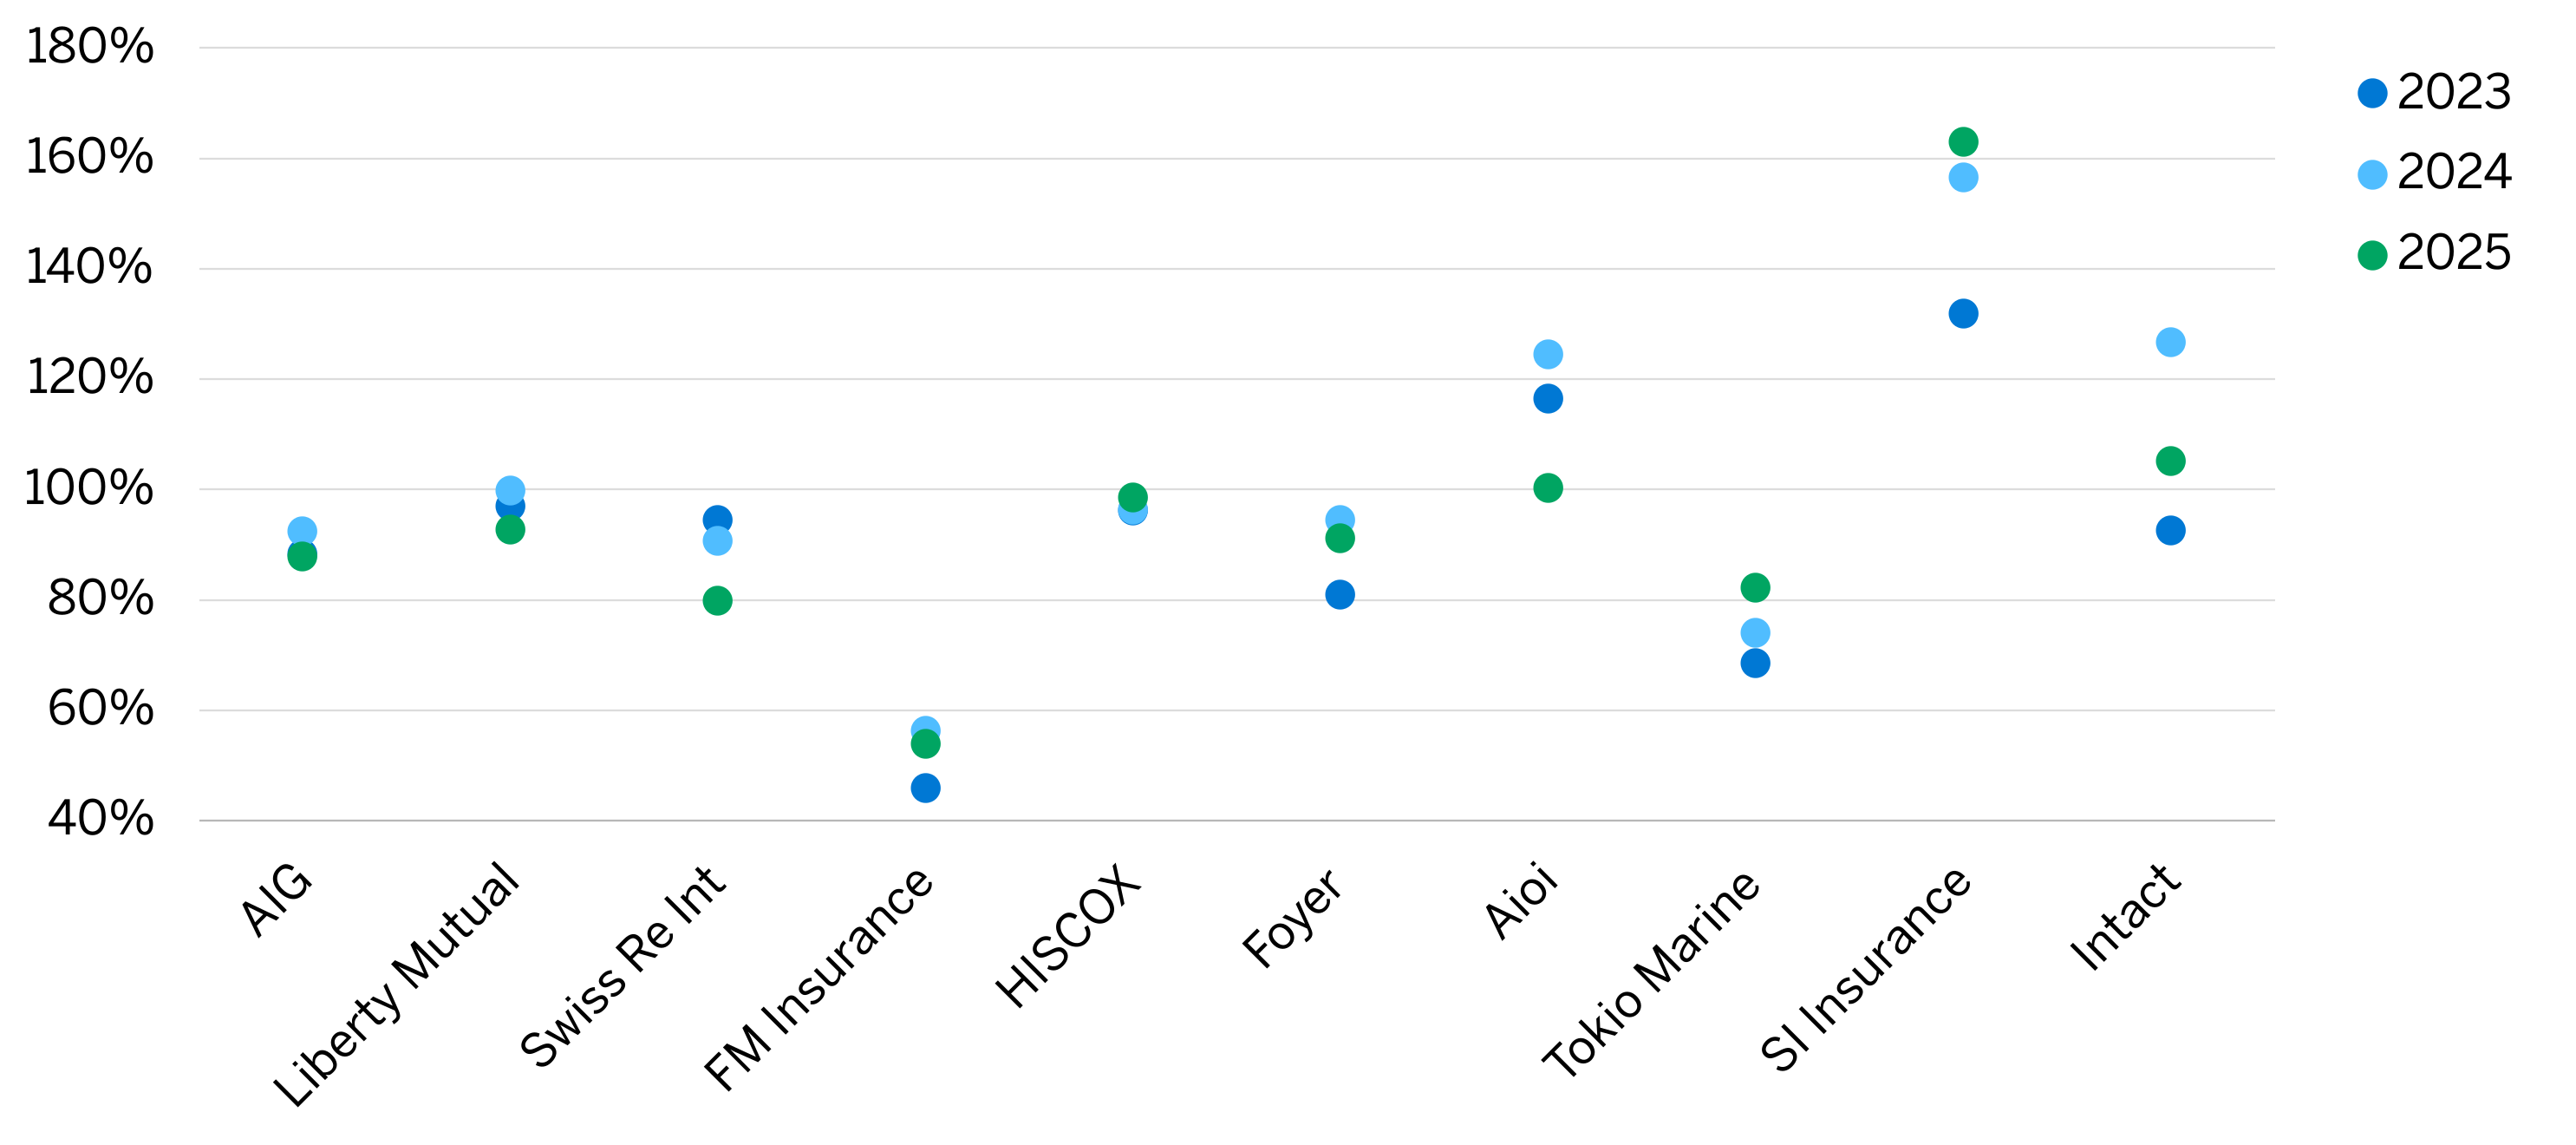
The combined ratio is calculated by dividing the sum of net claims paid, the change in net technical provisions and expenses incurred, by the net earned premium. The 2025 reported combined ratios show a larger interval (between 53% and 163%) compared to 2024 (between 56% and 156%). We observe an overall decrease in the GWP-weighted average combined ratio from 94% in 2024 to 88% in 2025, predominantly driven by improved claims experience. Most of the 10 insurers in the sample show a combined ratio below 100%. SI Insurance’s combined ratio increase is explained by growth in business and additional investment in strengthening of underwriting and operational capabilities in Continental Europe, resulting in administrative expenses and acquisition costs net of reinsurance commissions increase. Claims also increased in the general liability, property & marine, aviation and transport classes.15
Figure 3: Evolution of the combined ratios over time of the selected insurance entities
SCR coverage ratio
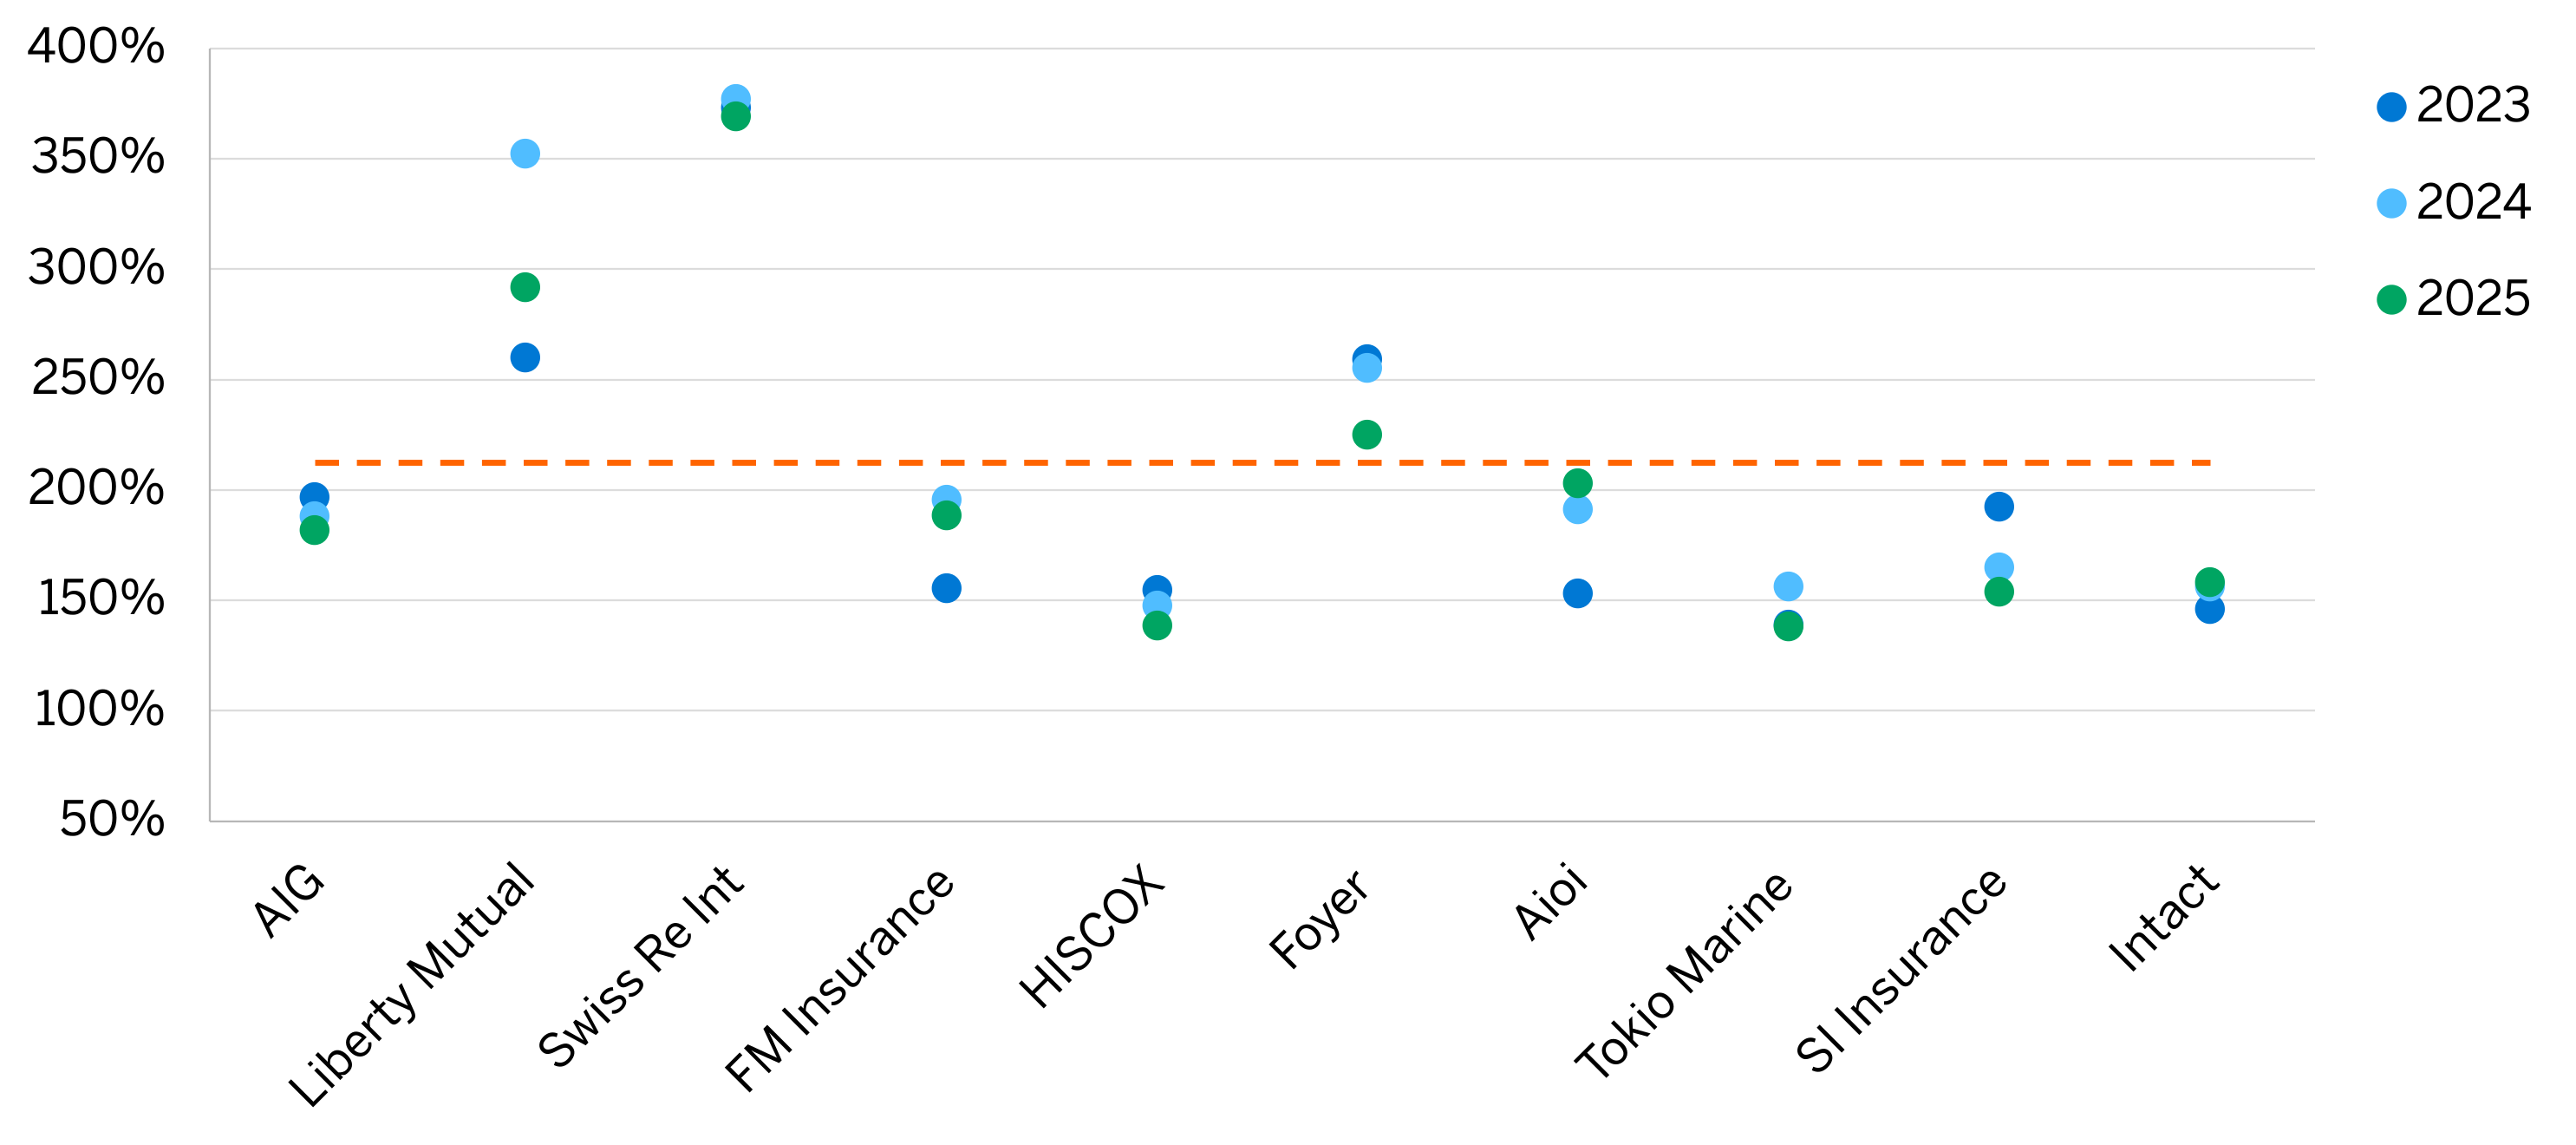
Solvency coverage can change year on year for a variety of reasons. Against this backdrop, Figure 4 shows the SCR coverage ratio of the companies included in our sample over the past three years.
The weighted average SCR coverage ratio for the companies included in our sample was 212% at year-end 2025, a decrease of 21% compared to 2024. Non-life insurers based in Luxembourg continue, however, to maintain a significant capital buffer above the required SCR coverage ratio of 100%. In 2025, most companies have a solvency coverage ratio between 150% and 300%, with the minimum in the sample amounting to 138% (HISCOX and Tokio Marine) and the maximum to 369% (Swiss Re Int., which uses an internal model). Note that the 2025 Intact’s solvency coverage ratio remains stable at approximately 158% compared to 2024.
As of year-end 2025, three insurance companies within the selected sample use an internal model: AIG, Liberty Mutual and Swiss Re Int.
Figure 4: The evolution of the SCR coverage ratio of the selected insurance entities
The solvency coverage ratio can be explained by the evolution of its components: the own funds and the SCR amount. Figure 5 shows the evolution of those two components and the solvency coverage ratio.
The solvency coverage ratio decreased for most companies in the sample. The largest declines are explained by the following factors:
- Liberty Mutual: a reduction in eligible own funds (EOF), mainly reflecting the deliberate release and distribution of surplus capital through the reduction of ancillary own funds and the proposed dividend (decrease from 316% to 292%). This was compounded by adverse foreign exchange-related Solvency II valuation movements.16
- Foyer: an increase in the SCR that outpaced the growth in EOF. The increase was primarily driven by higher market risk, reflecting changes in the investment portfolio and the substantial increase in equity exposure.17
- Tokio Marine: The apparent decrease from 156% to 138% mainly reflects the deduction of a foreseeable dividend. On the comparable basis presented in the 2025 SFCR, the ratio increased from 134% to 138%.18
- SI Insurance: an increase in the SCR that exceeded the growth in EOF. The SCR increase mainly reflected higher counterparty default risk arising from increased receivables and, to a lesser extent, higher non-life underwriting risk due to higher gross best estimate reserves. Although the company received a €60 million capital contribution, its impact on EOF was largely offset by the loss recorded during the year.19
By contrast, Aioi recorded an increase in its solvency coverage ratio, as EOF grew faster than the SCR, mainly reflecting the company’s return to profitability and the retention of earnings. This offset the SCR increase, which was primarily driven by higher non-life underwriting risk.20
Figure 5: evolution of the SCR ratio components of the selected insurers (figure in € millions)
| INSURER | OF 2025 |
OF 2024 |
OF CHANGE |
SCR 2025 |
SCR 2024 |
SCR CHANGE |
SCR RATIO EVOLUTION |
|---|---|---|---|---|---|---|---|
| AIG | 2,522 | 2,394 | +128 | 1,387 | 1,273 | +114 | -6% |
| Liberty Mutual | 3,083 | 3,827 | -744 | 1,056 | 1,086 | -30 | -60% |
| Swiss Re Int | 590 | 514 | +76 | 160 | 136 | +24 | -8% |
| FM Insurance | 2,309 | 2,132 | +176 | 1,226 | 1,092 | +135 | -7% |
| HISCOX | 120 | 128 | -8 | 87 | 87 | 0 | -9% |
| Foyer | 478 | 448 | +29 | 212 | 175 | +36 | -30% |
| Aioi | 277 | 221 | +56 | 136 | 116 | +21 | +12% |
| Tokio Marine | 265 | 338 | -73 | 192 | 216 | −24 | −18% |
| SI Insurance | 203 | 191 | +12 | 132 | 116 | +16 | -11% |
| Intact | 140 | 143 | −3 | 88 | 92 | -3 | +2% |
| Total | 9,986 | 10,337 | -351 | 4,678 | 4,388 | +289 | -21% |
SCR – Standard Formula
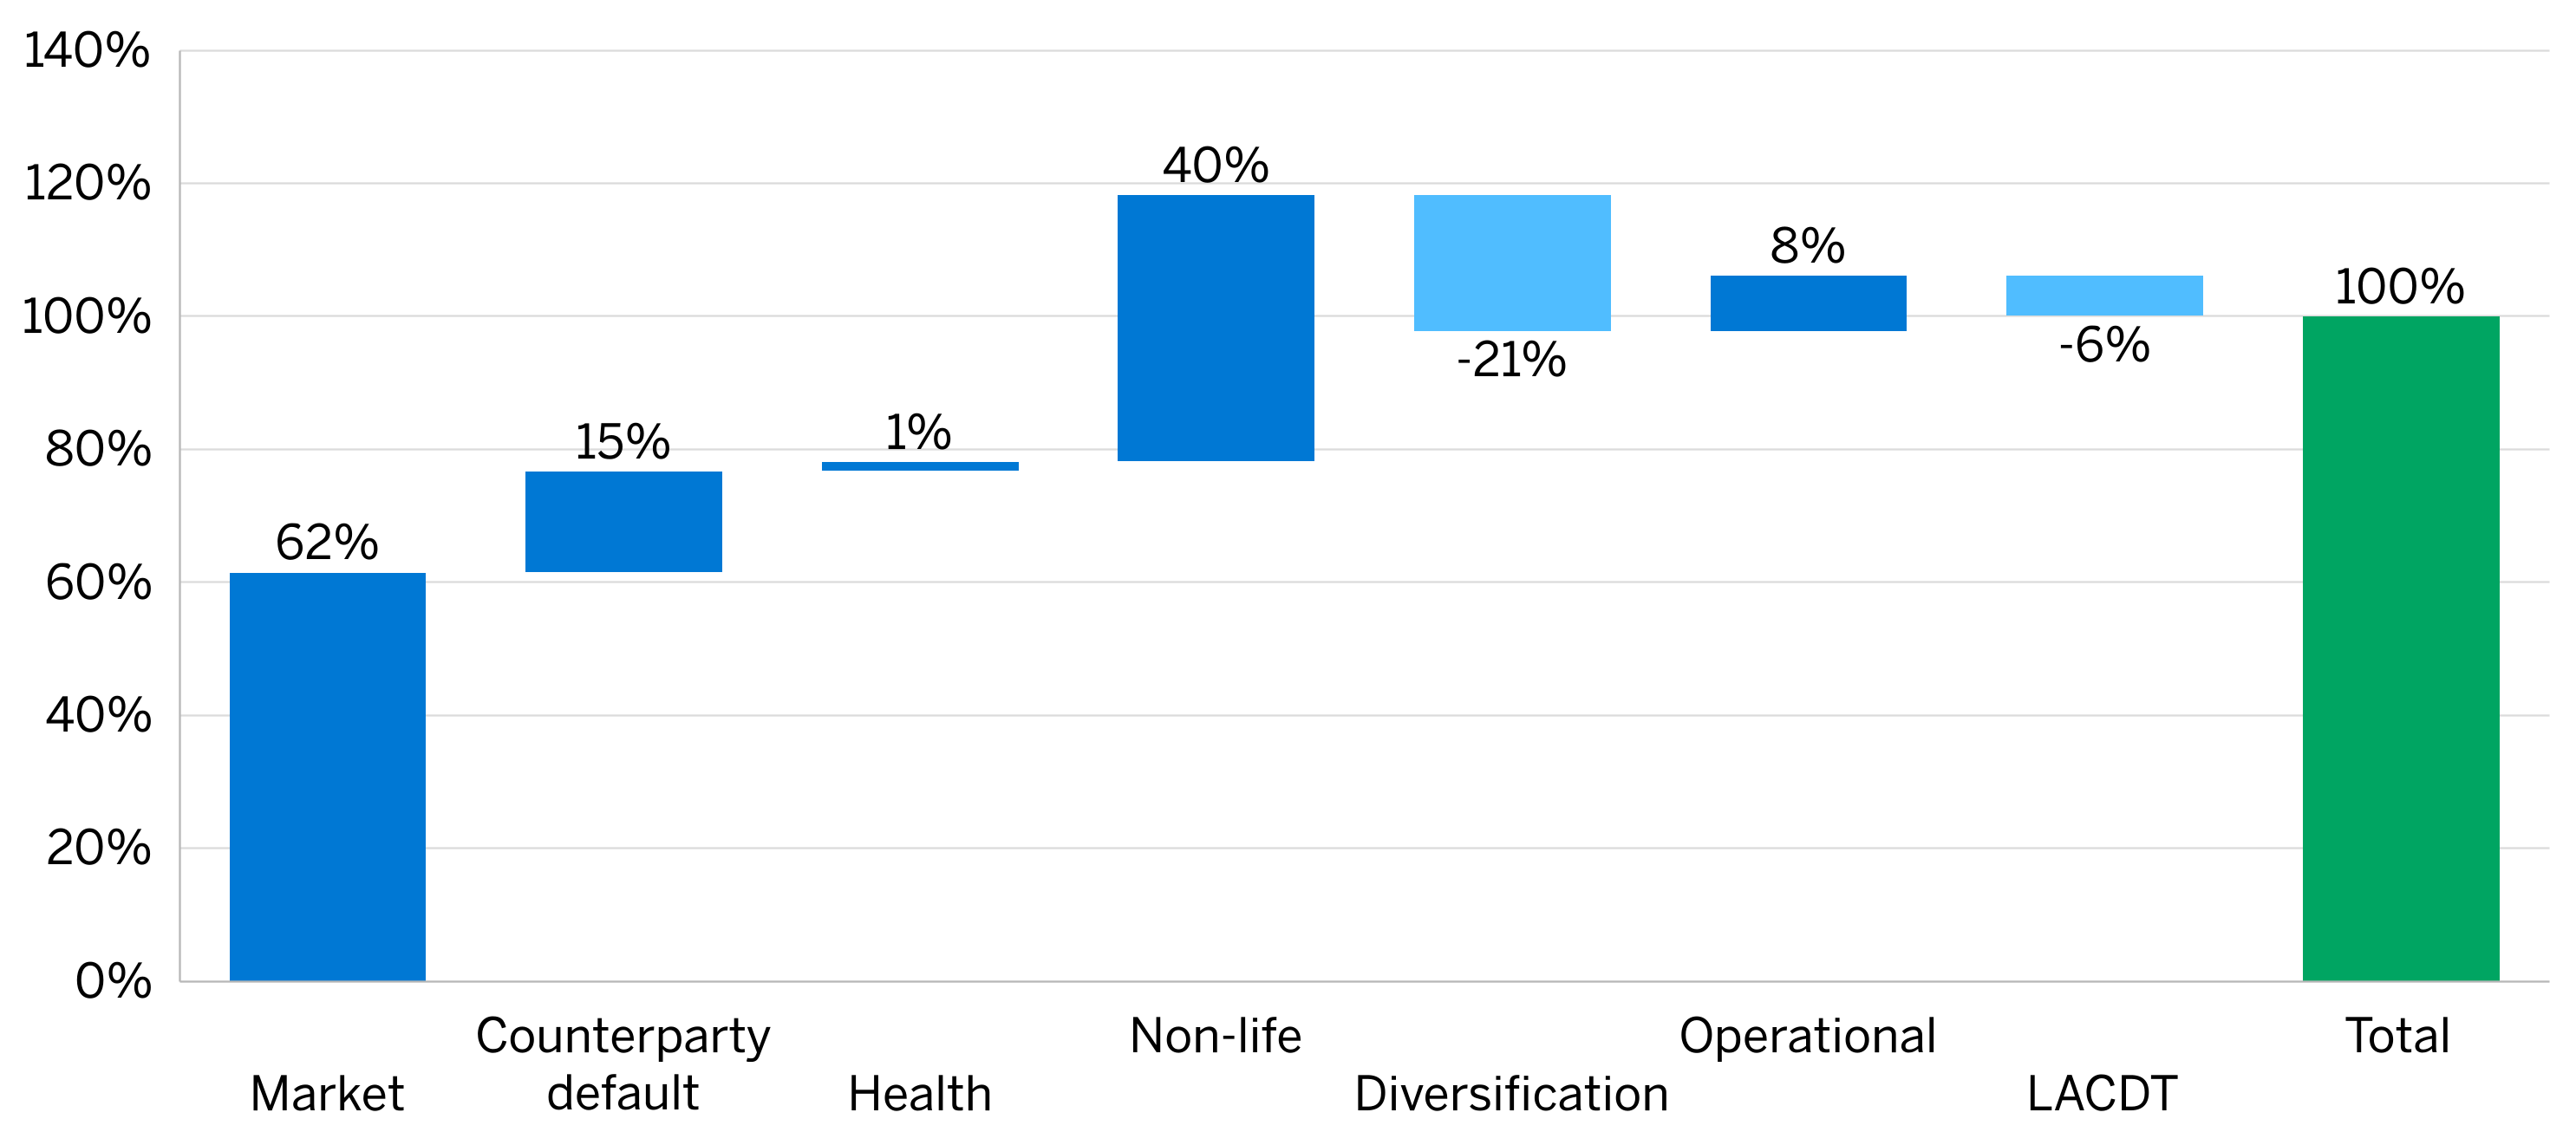
The Standard Formula SCR21 as per 31 December 2025 for the companies in our sample is unsurprisingly dominated by non-life underwriting risk and market risk, followed by the counterparty default risk. The diversification and loss-absorbing capacity of deferred taxes (LACDT) benefits offset these risks to reduce the SCR.
Figure 6: Breakdown of SCR under the Standard Formula of the selected insurance entities
Own funds
EOF are divided into three tiers based on quality: Tier 1 capital is the highest ranking with the greatest loss-absorbing capacity, such as retained earnings and share capital. Tier 2 funds are typically composed of hybrid debt, and Tier 3 typically comprises deferred tax assets. Own funds of the selected insurers are dominated by Tier 1, which makes up 96% of the own funds in 2025, whose allocation has continuously increased since 2023.
Figure 7: Evolution of the tiering of own funds of the selected insurance entities
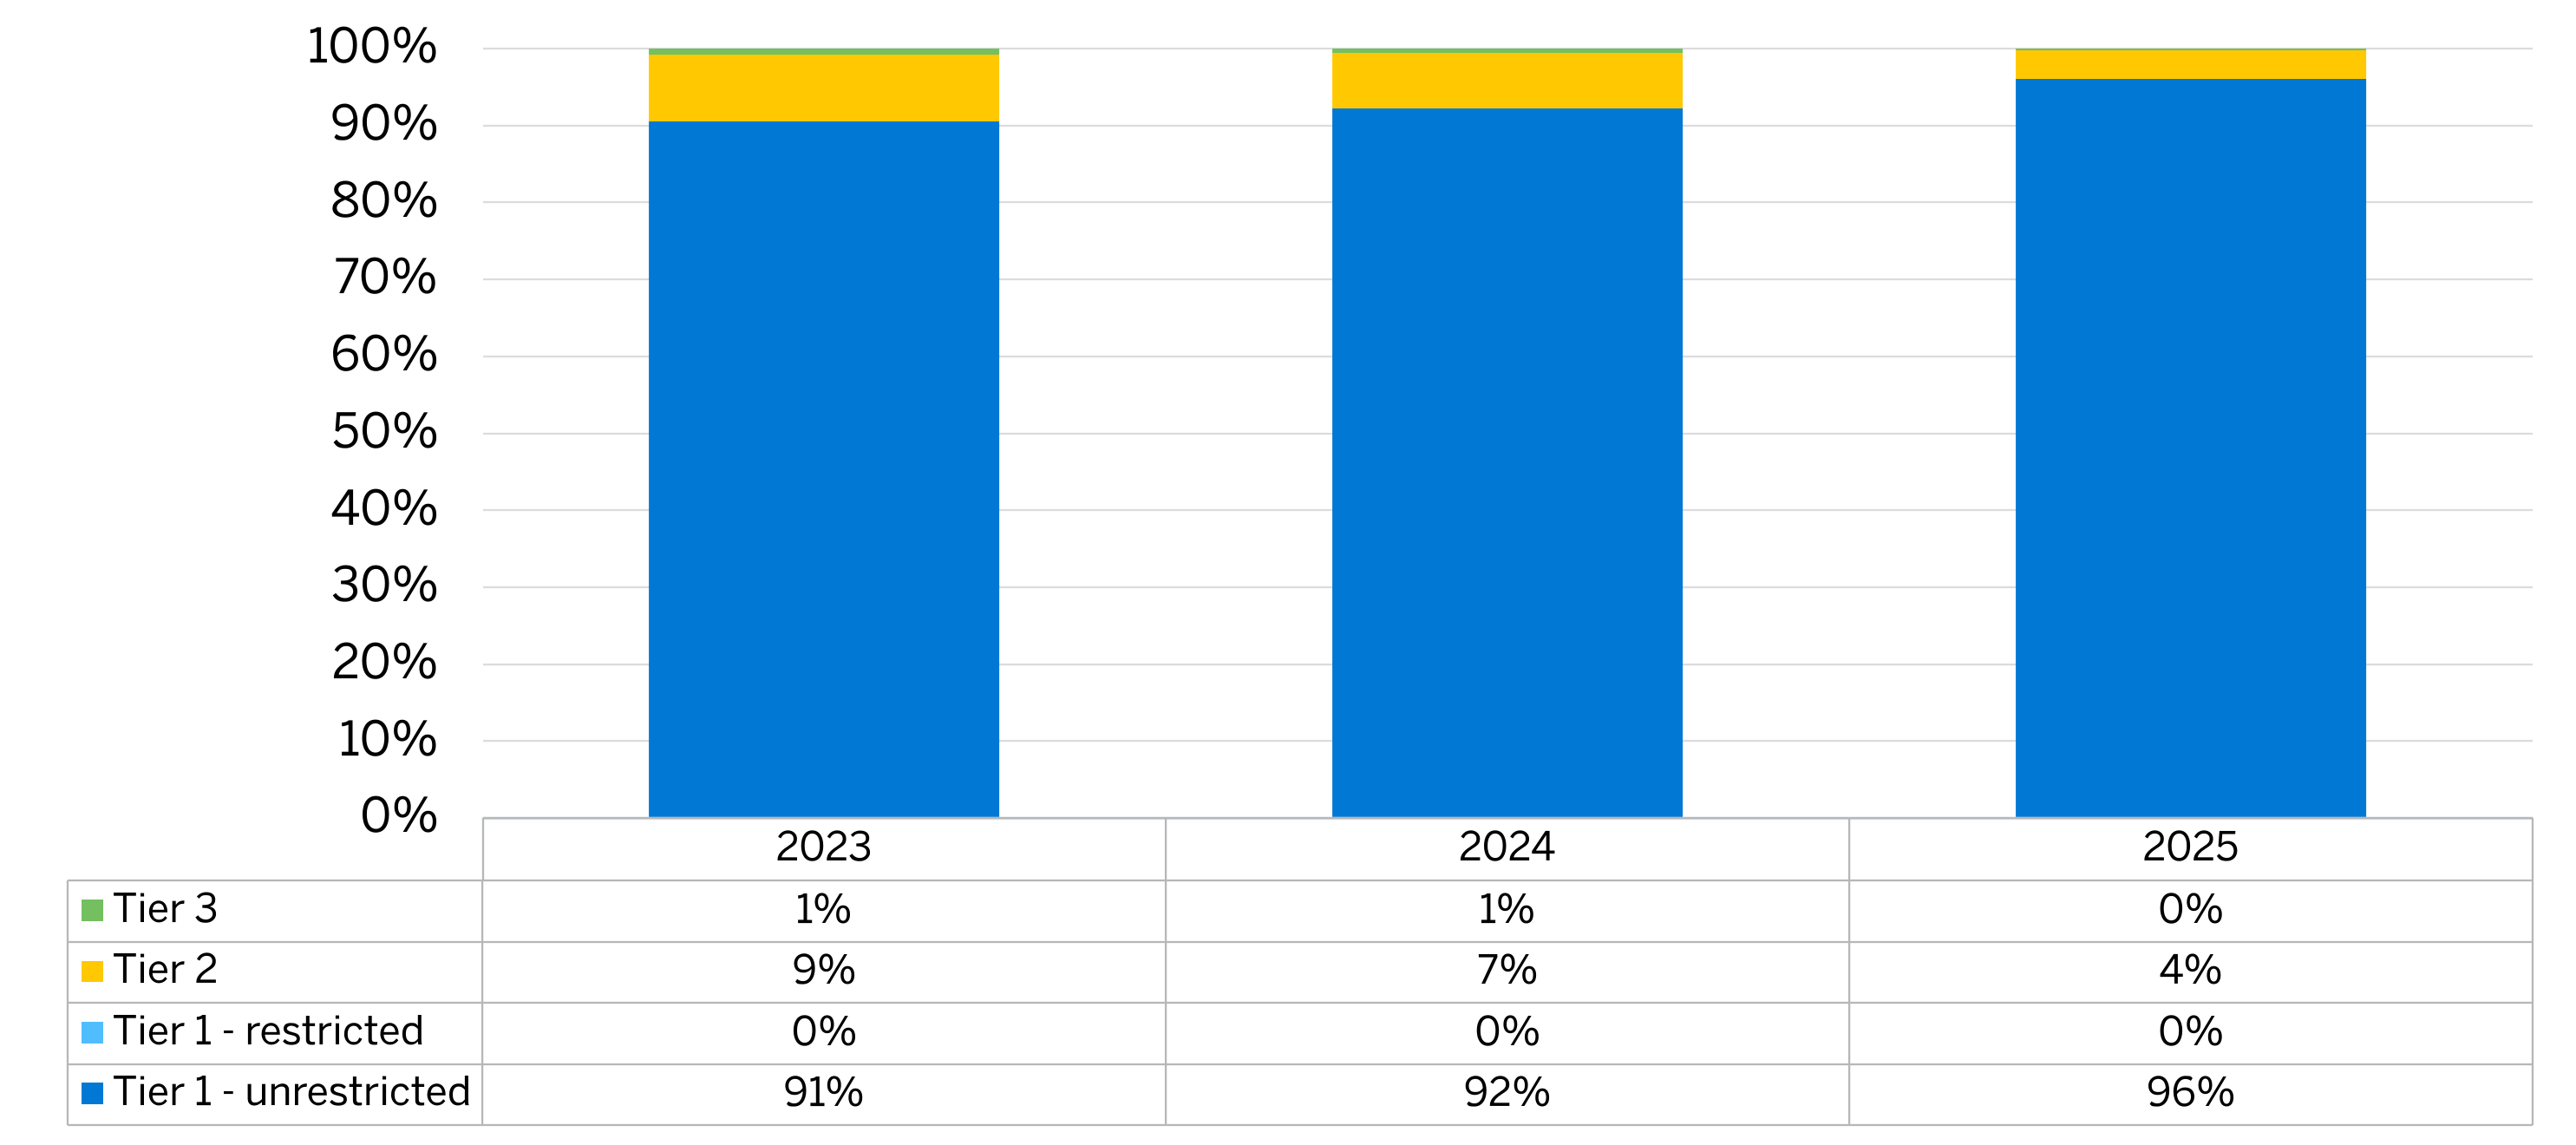
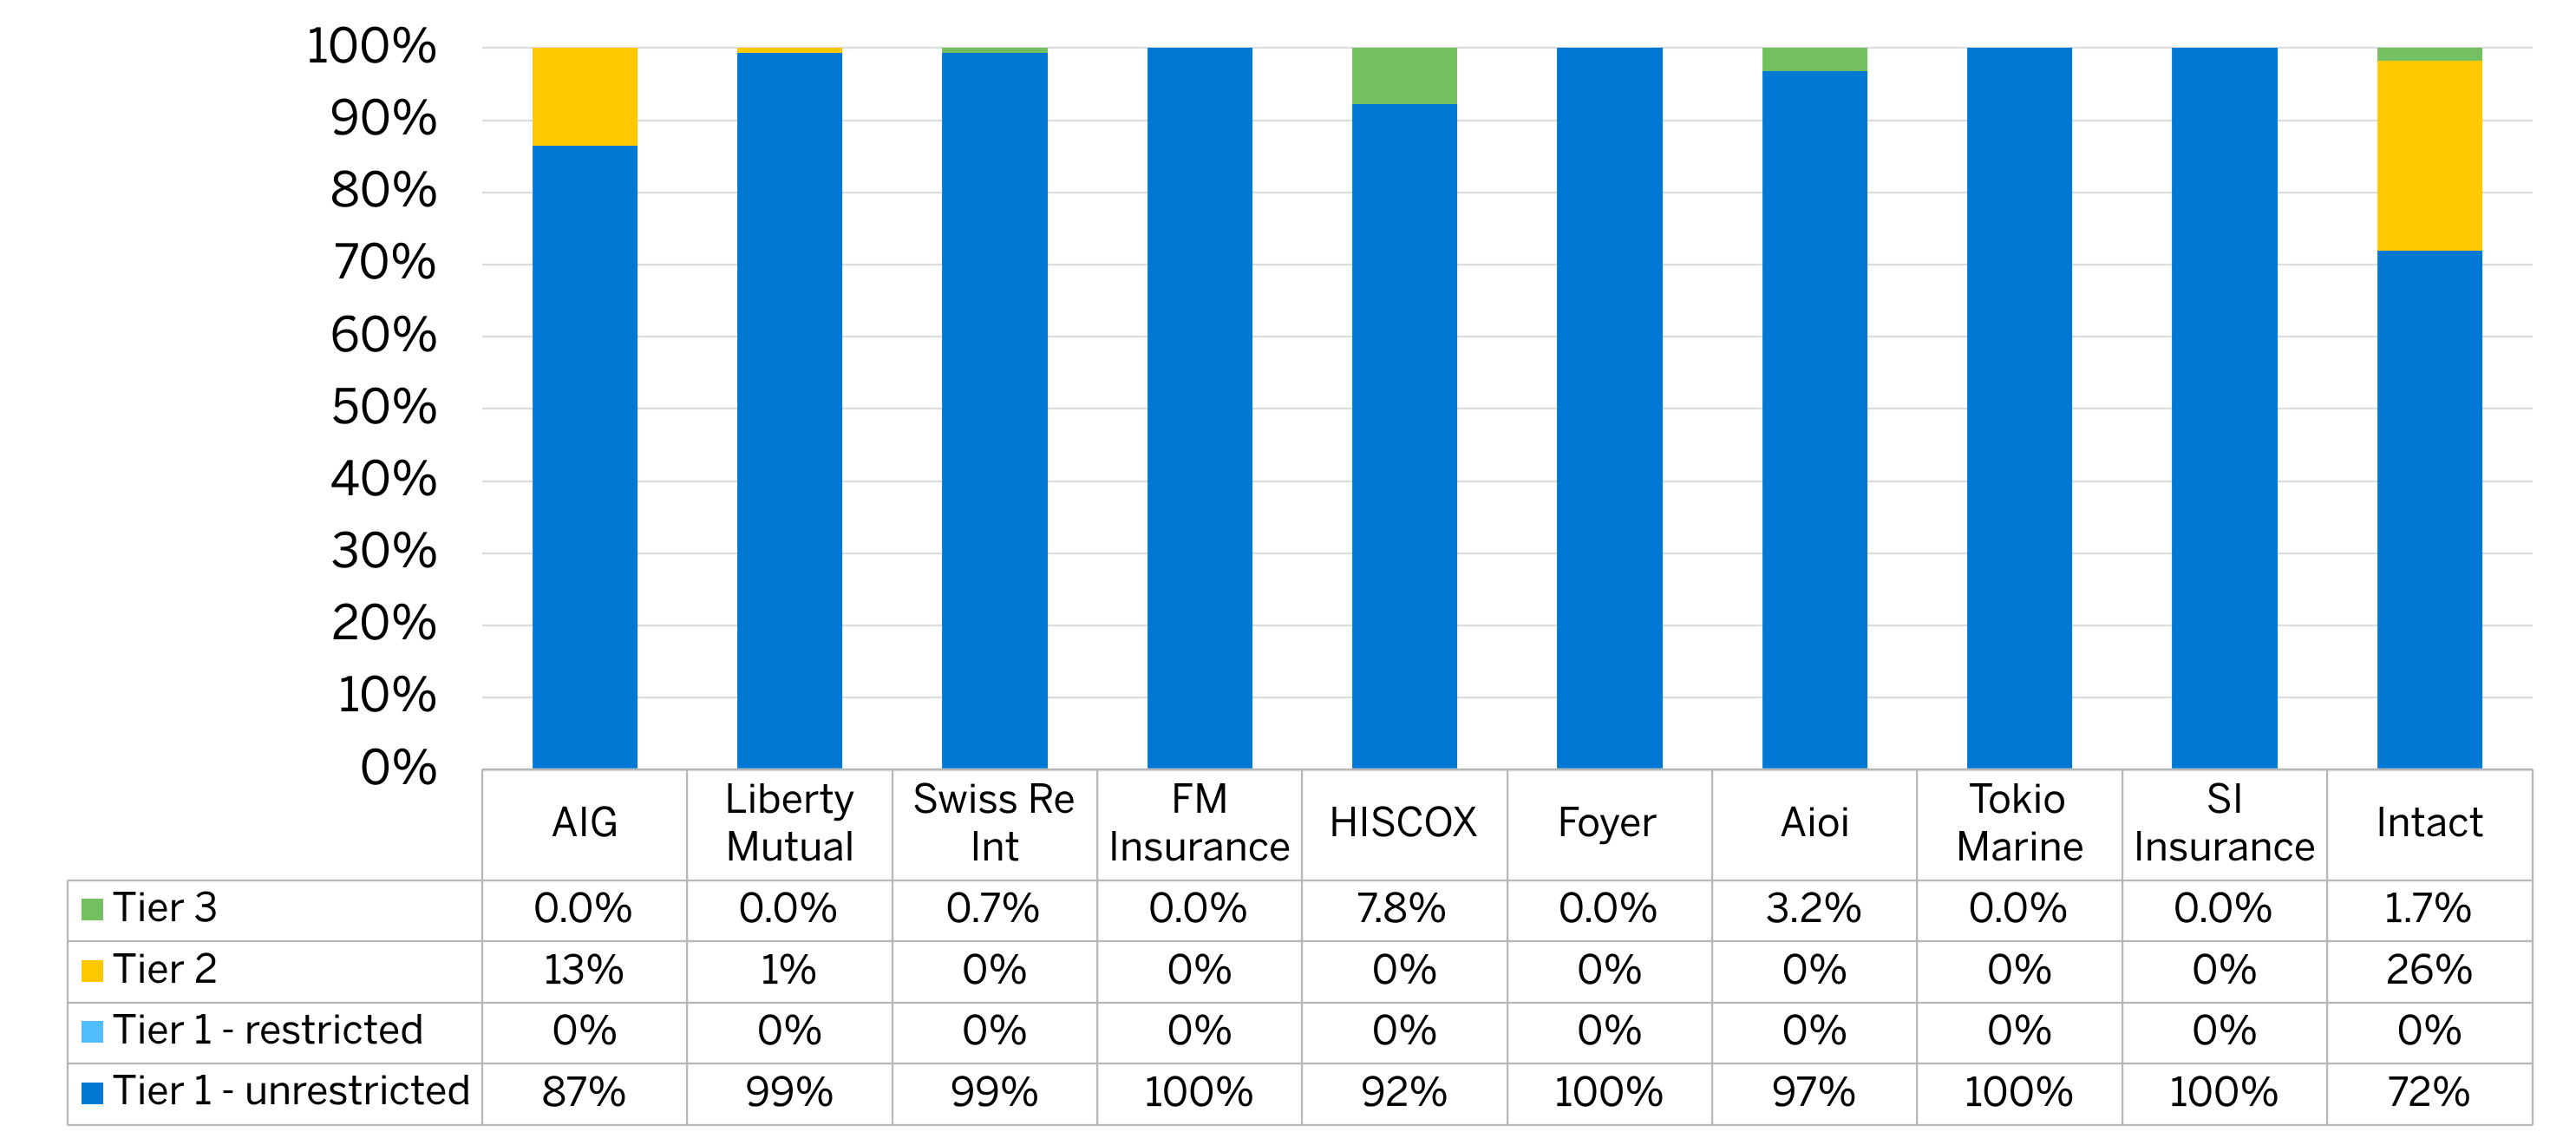
Figure 8 shows that FM Insurance, Foyer, Tokio Marine and SI Insurance have EOF composed of 100% of Tier 1—unrestricted own funds. From the 10 largest insurers, only three insurers in our sample (AIG, Liberty Mutual and Intact) have Tier 2 own funds. The weighted average of Tier 2 capital compared to their total own funds amounts to about 8.2%. Figure 8 shows, however, that the share of the Tier 2 capital for both Intact and AIG is much higher. Four insurers of the sample have Tier 3 capital (Swiss Re Int., HISCOX, Aioi and Intact), ranging from 0.7% to 7.8% with respect to their total own funds, with a 2.1% weighted average of Tier 3 capital.
During 2025, SI Insurance received a capital injection of €60 million,22 while HISCOX’s ordinary share capital increased by €12 million.23
Figure 8: Tiering of funds of the selected insurance entities per year-end 2025
Investments
The total assets on the Solvency II balance sheet for the selected non-life insurers amount to €36.8 billion per year-end 2025, with about 63% related to investments. They represent a total market value of €23.3 billion, an increase of 5% compared to year-end 2024 (€22.3 billion), mainly reflecting business inflows and favourable market movements.
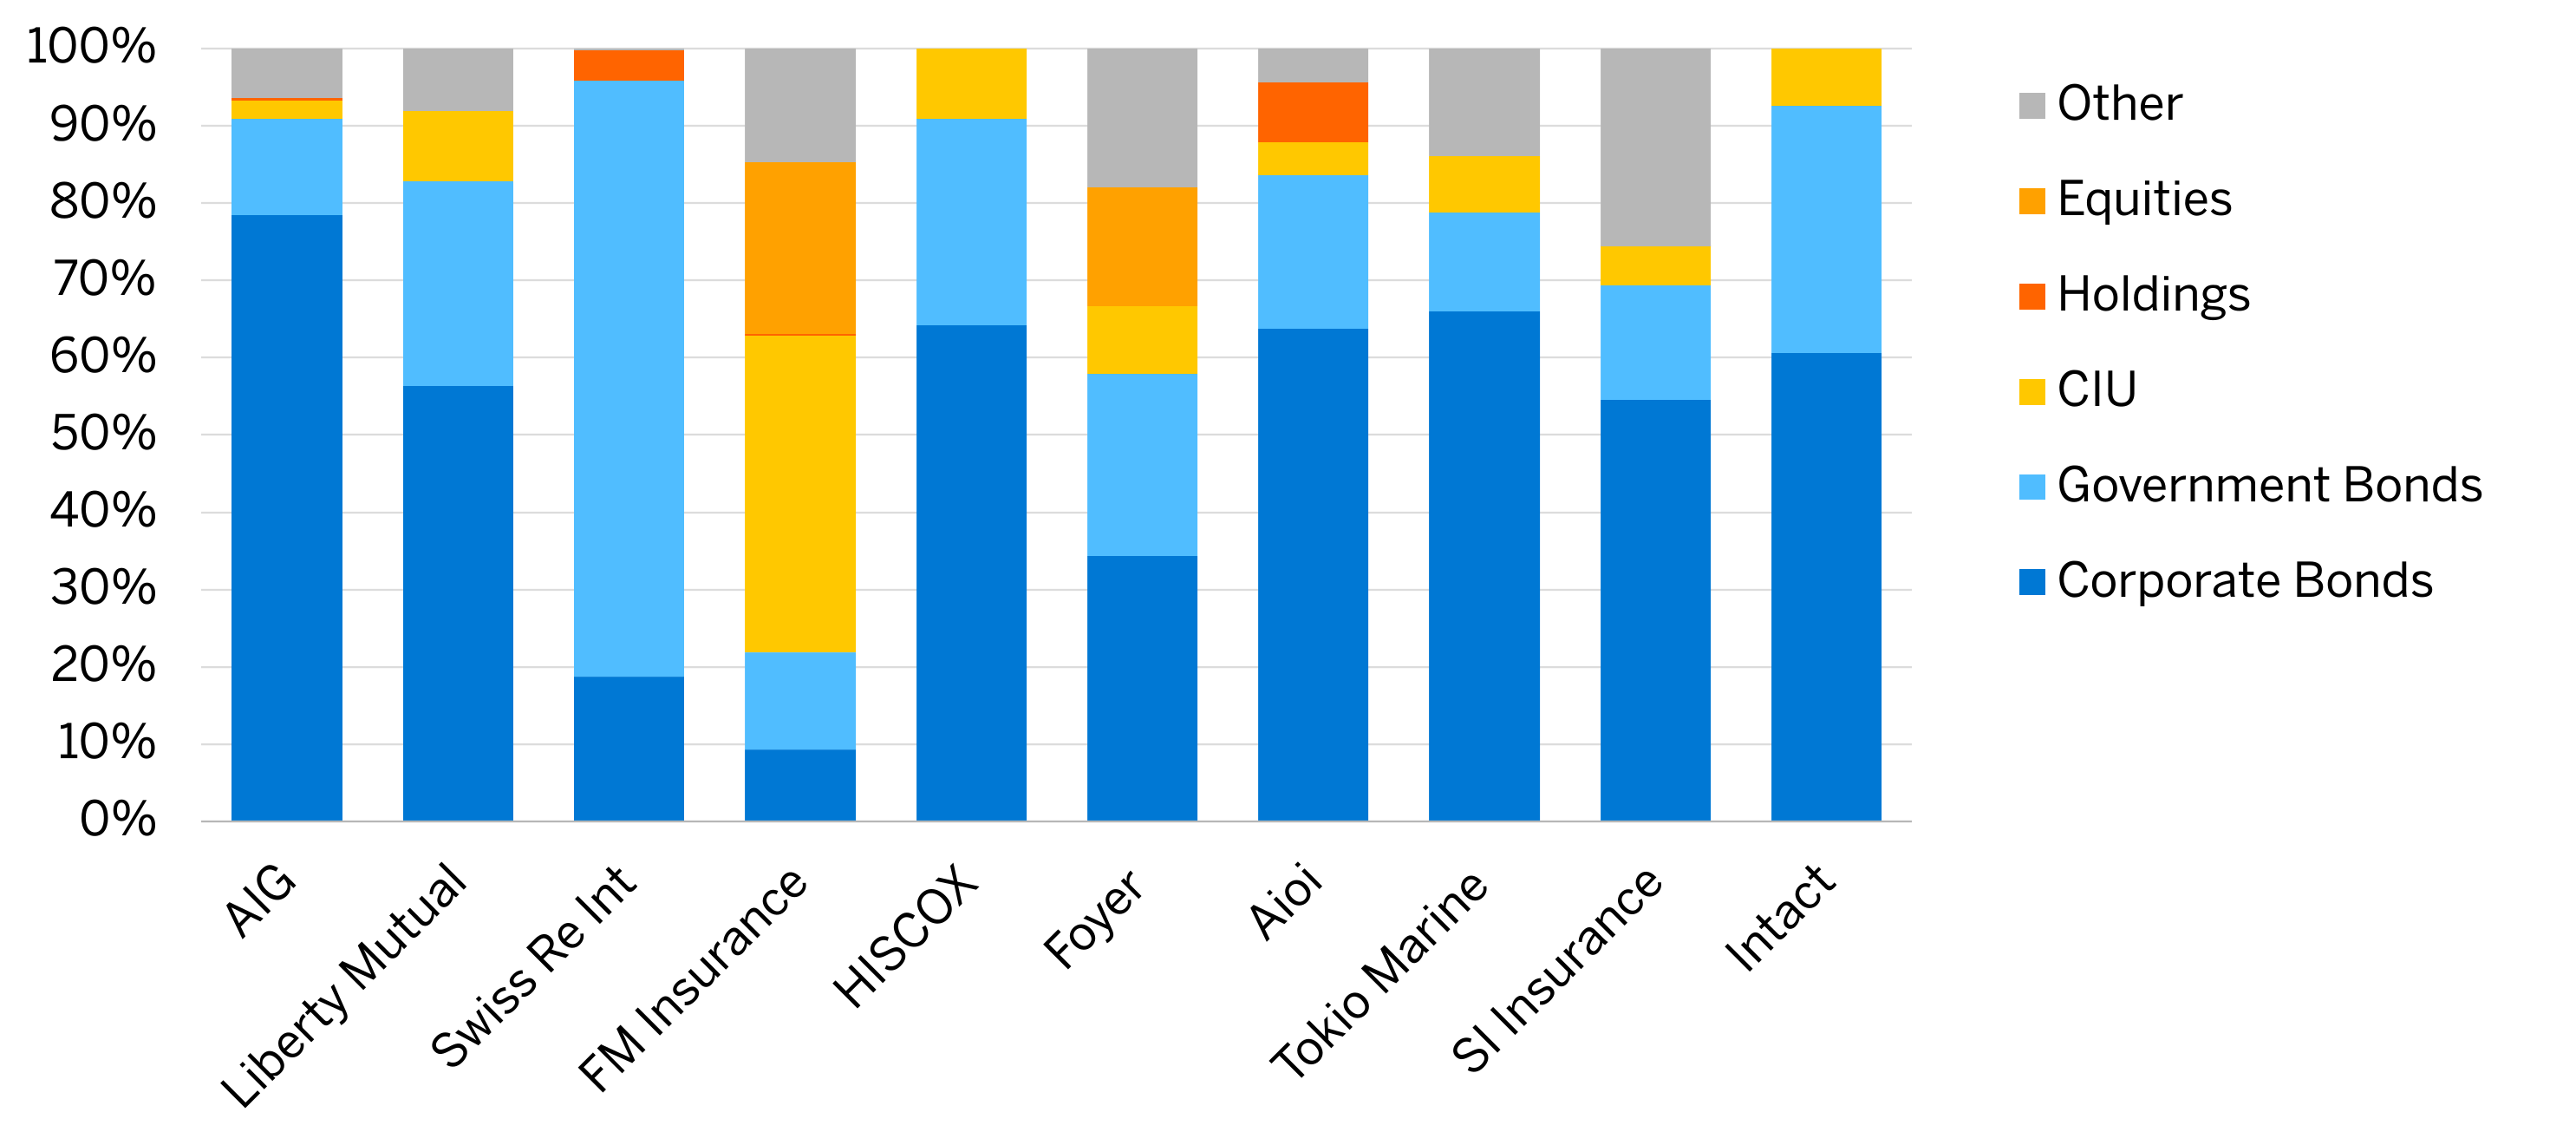
The investment portfolios of the selected insurers can be further broken down by asset class, as presented in Figure 9. Non-life insurers included in our sample focus on fixed-income investments (about 78%), with main investments in government bonds and corporate bonds. Part of the investment (9%) is allocated to collective investment undertaking (CIU), which slightly increased compared to 2024.
Figure 9: Allocation of investments of the selected insurance entities
Figure 10: Investment mix of the selected insurance entities
What’s next?
The Solvency II 2020 review introduces key changes that will become effective early 2027, including a lower cost of capital for risk margin calculations, changes in the calculation of the Standard Formula SCR (i.e., NatCat risk, market- and counterparty default risk, and recognition of non-proportional reinsurance), and the streamlining of Pillar 3 disclosures. Insurers will need to adapt their capital models, governance, policies and disclosure processes to align with these requirements.
Milliman has developed an interactive application to efficiently compare the metrics of insurers as disclosed in their QRTs. If you want to learn more, or receive free access to the tool, please follow the link https://apps.nl.milliman.com/lu/non-life or send an email to [email protected].
If you have any questions or comments on the information above or want to discuss further capital management solutions for non-life insurers, please contact your usual Milliman consultant.
Appendix: List of insurers included and full names
| FULL NAME | NAME USED |
|---|---|
| AIG Europe S.A. | AIG |
| Aioi Nissay Dowa Insurance Company of Europe SE | Aioi |
| FM Insurance Europe S.A. | FM Insurance |
| Foyer Assurances S.A. | Foyer |
| Hiscox S.A. | HISCOX |
| Intact Insurance (Europe) S.A. | Intact |
| Liberty Mutual Insurance Europe SE | Liberty Mutual |
| SI Insurance (Europe), S.A. | SI Insurance |
| Swiss Re International SE | Swiss Re Int |
| Tokio Marine Europe S.A. | Tokio Marine |
1 This analysis is based on insurance companies only, considering their direct business but also their proportional and non-proportional reinsurance written premiums. Reinsurers were excluded from the analysis.
2 European Insurance and Occupational Pensions Authority. (8 May 2026). Premiums, claims and expenses dataset. Retrieved 6 August 2026 from https://www.eiopa.europa.eu/tools-and-data/insurance-statistics_en#premiums-claims-and-expenses.
3 Luxembourg Insurance and Reinsurance Association. (26 March 2026). ACA annual report: Key figures 2025. Retrieved 6 August 2026 from https://www.aca.lu/wp-content/uploads/2026/03/Key-Figures-2025-ACA.pdf.
4 Swiss Re. (5 November 2024). Swiss Re agrees to sell iptiQ's European P&C business to Allianz Direct. Retrieved 6 August 2026 from https://www.swissre.com/press-release/Swiss-Re-agrees-to-sell-iptiQ-039-s-European-P-and-C-business-to-Allianz-Direct/04617310-4634-4f5b-805c-d1f2da77e94c.
5 Baloise. (5 December 2025). Completion of merger to form Helvetia Baloise Holding Ltd. Retrieved 6 August 2026 from https://www.baloise.lu/en/insurance-baloise-luxembourg/who-are-we/news/2025/merger-Helvetia-Baloise-Holding-Ltd.html.
6 Intact Insurance. (7 October 2025). RSA becomes Intact Insurance. Retrieved 6 August 2026 from https://www.intactinsurance.eu/fr/actualites/rsa-devient-intact-insurance.
7 CAA. (14 January 2025). Circular Letter 25/1. Retrieved 6 August 2026 from https://www.caa.lu/uploads/documents/files/LC25-01_FR.pdf.
8 Based on FY2025 reported EIOPA figures, taking the sum over direct, proportional and non-proportional written premiums. For more information, see https://www.eiopa.europa.eu/tools-and-data/insurance-statistics_en#premiums-claims-and-expenses.
9 European Insurance and Occupational Pensions Authority, op. cit.
10 Swiss Re. (13 April 2026). Solvency and Financial Condition Report: For the reporting period ended 31 December 2025. Retrieved 6 August 2026 from https://www.swissre.com/dam/jcr%3Af9013bcb-b857-4176-b55d-1d714d9e0c01/swiss-re-international-sfcr-ye-2025.pdf.
11 Tokio Marine. (31 March 2026). Solvency and Financial Condition Report: 31 December 2025. Retrieved 6 August 2026 from https://www.tmhcc.com/en/-/media/project/tokio-marine/tmhcc-row/old-sitecore/row/financial-ratings/financial-documents/2025/solvency-and-financial-conditions-report-2025---tokio-marine-europe-sa.pdf.
12 Please note that this includes direct, proportional and non-proportional written premiums.
14 Lines of business with zero written premiums are excluded from the graph, and NP stands for non-proportional.
15 SI Insurance. (2026). Solvency and Financial Condition Report: For the year ended 31 December 2025. Retrieved 6 August 2026 from https://www.sompo.com/globalassets/files/legal-and-compliance/enterprise-risk-management-documents/siie-sfcf-2025-final.pdf.
16 Liberty Mutual. (7 April 2026). Solvency and Financial Condition Report: As at 31 December 2025. Retrieved 6 August 2026 from https://www.libertyspecialtymarkets.com/get-document/2f392c9d-b73e-41c3-98fd-79e202dc5744.
17 Foyer. (21 April 2026). Solvency and Financial Condition Report. Retrieved 6 August 2026 from https://www.foyer.lu/fr/mydoc/WebSites-Documentsgroupe-377.
20 Aioi. (2 April 2026) Solvency and Financial Condition Report 2025. Retrieved 6 August 2026 from https://www.and-e.com/assets/AND-E-SE-SFCR-2025.pdf.
21 AIG, Swiss Re Int. and Liberty Mutual have been excluded in the breakdown shown in Figure 6, as they use internal models.
23 HISCOX. (April 2026). Solvency and Financial Condition Report 2026. Retrieved 6 August 2026 from https://www.hiscox.lu/sites/luxembourg/files/2026-04/HiscoxSA-Solvency_and_Financial_Condition_Report_2025.pdf.