This briefing note analyses the year-end 2025 Solvency and Financial Condition Reports (SFCRs) and Quantitative Reporting Templates (QRTs) of 17 direct life insurers based in Luxembourg: 15 large cross-border entities selected by total assets and two local insurers, Foyer Vie and La Luxembourgeoise Vie. The sample represents €258.9 billion of assets and €30.2 billion of gross written premiums (GWP).
Key messages from Luxembourg’s 2025 SFCR reports
- Scale and momentum. Sample assets increased by 9% and GWP by 17%, reflecting strong demand, particularly in international and investment-linked business.
- Unit-linked (UL) concentration. Index-linked (IL) & UL business accounts for 79% of assets, 81% of technical provisions (TP) and 75% of GWP. Market performance, net flows and unit-hedging discipline therefore remain central to results.
- Resilient capital, uneven outcomes. The aggregate solvency ratio was 162%, up 2 percentage points, and 86% of eligible own funds (EOF) were Tier 1. Company-level movements were nevertheless material, partly reflecting differences in sensitivity to the higher, more upward-sloping risk-free curve, as well as reinsurance, new-business strain and capital actions.
- Reinsurance is particularly important for traditional business. Life with profit participation is heavily reinsured, with recoverables equal to 61% of its gross best estimate. More broadly, reinsurance recoverables represent approximately 47% of assets, excluding UL assets, reducing insurance and market risks while increasing counterparty and intragroup dependencies.
Life insurance industry market developments
The market remained resilient despite the compulsory liquidation of FWU Life Insurance Lux S.A. Consolidation continued through the integration and rebranding of Lombard International as Utmost Luxembourg and the completion of the Helvetia-Baloise merger. The Digital Operational Resilience Act (DORA) also brought greater supervisory focus to information and communication technology (ICT) risk, outsourcing, cyber resilience and incident management.
Life insurance market scale and technical provisions
The selected insurers held €258.9 billion of assets at year-end 2025, 9% more than in 2024 and approximately 98.6% of the Luxembourg life market total reported by the Association des Compagnies d’Assurances et de Réassurances (ACA, Luxembourg Insurance and Reinsurance Association). The five largest entities represented about 60% of sample assets, confirming a concentrated market led by cross-border groups.
TP increased by 8% in 2025, after 10% growth in 2024. The mix remained stable: IL & UL obligations represented 81%, life with profit participation 18%, and other life less than 1%. Growth was driven mainly by favourable market performance, premium inflows and continued demand for investment-linked and guaranteed-return products.
Figure 1: Evolution of TP by line of business for the selected insurers (in € millions)
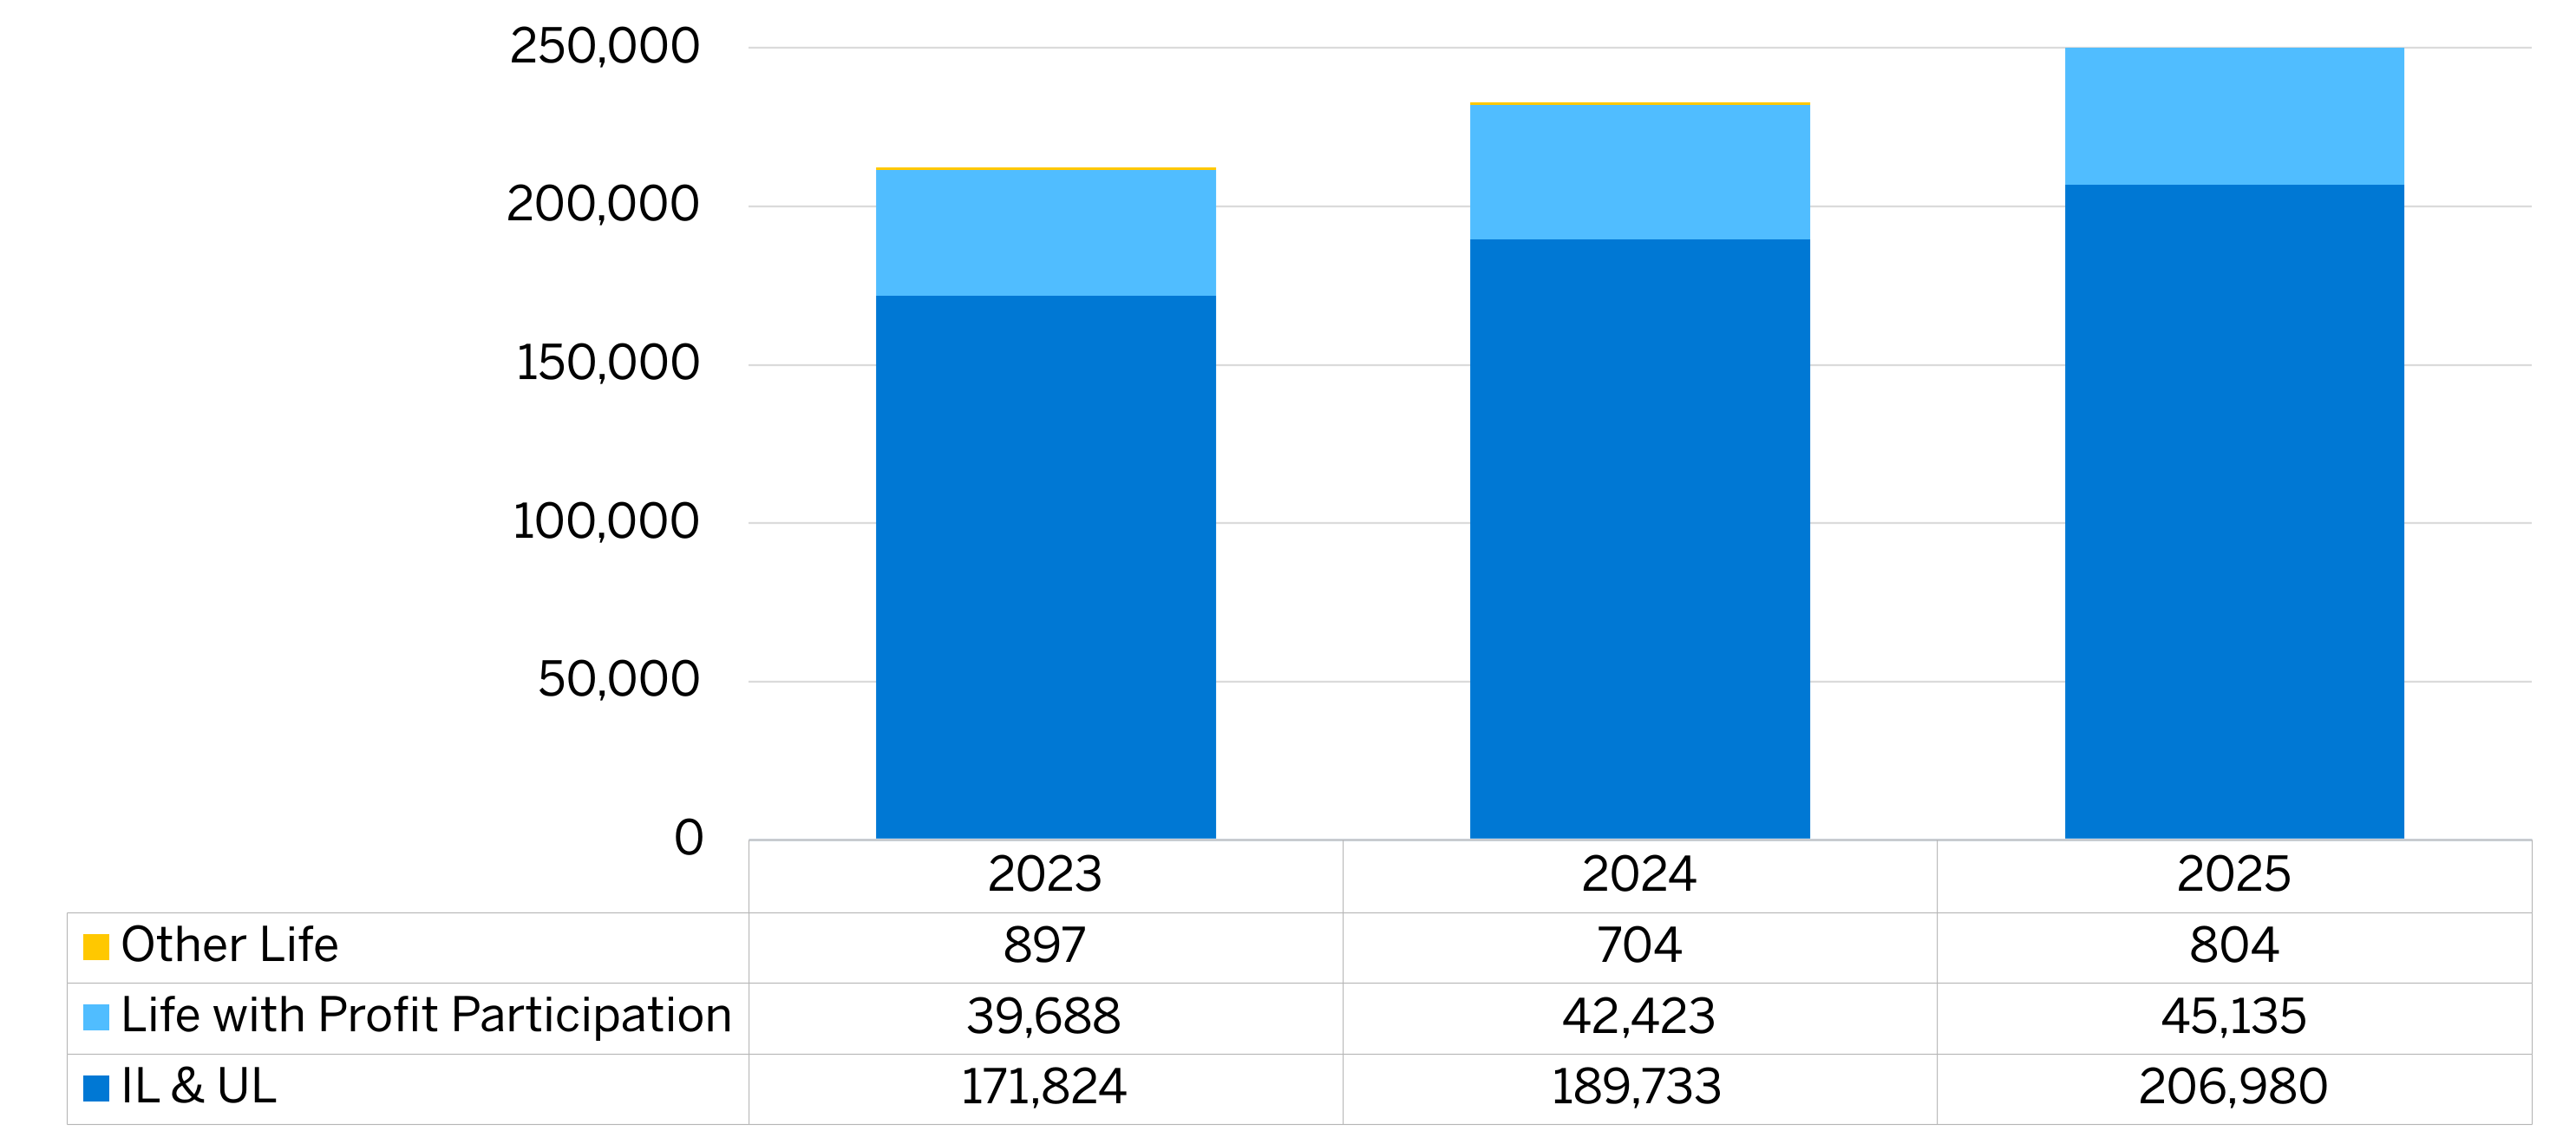
Traditional business remains more reinsurance intensive. Recoverables represented 61% of the gross best estimate for life with profit participation, mainly through proportional or financial arrangements covering guaranteed euro funds. These arrangements are predominantly intragroup. Risk margins were generally 0.2% to 1% of TP, with Foyer an outlier at approximately 4%.
Life insurance assets and capital quality
UL assets represented 79% of the Solvency II balance sheet. Most insurers held UL assets slightly above the corresponding best estimate liabilities (BEL); the mismatch was generally 0.1% to 3%. La Luxembourgeoise remained below 100% in each of the last three years, at 97.9% in 2025. More dynamic unit hedging has reduced, but not eliminated, the resulting market-risk exposure.
Excluding UL assets, reinsurance recoverables and investments together represented approximately 93% of assets. Their relative weight shifted modestly towards investments in 2025, while cash increased slightly, and loans & mortgages remained limited.
Figure 2: Asset allocation (excluding UL assets) of the selected insurers (in € millions)
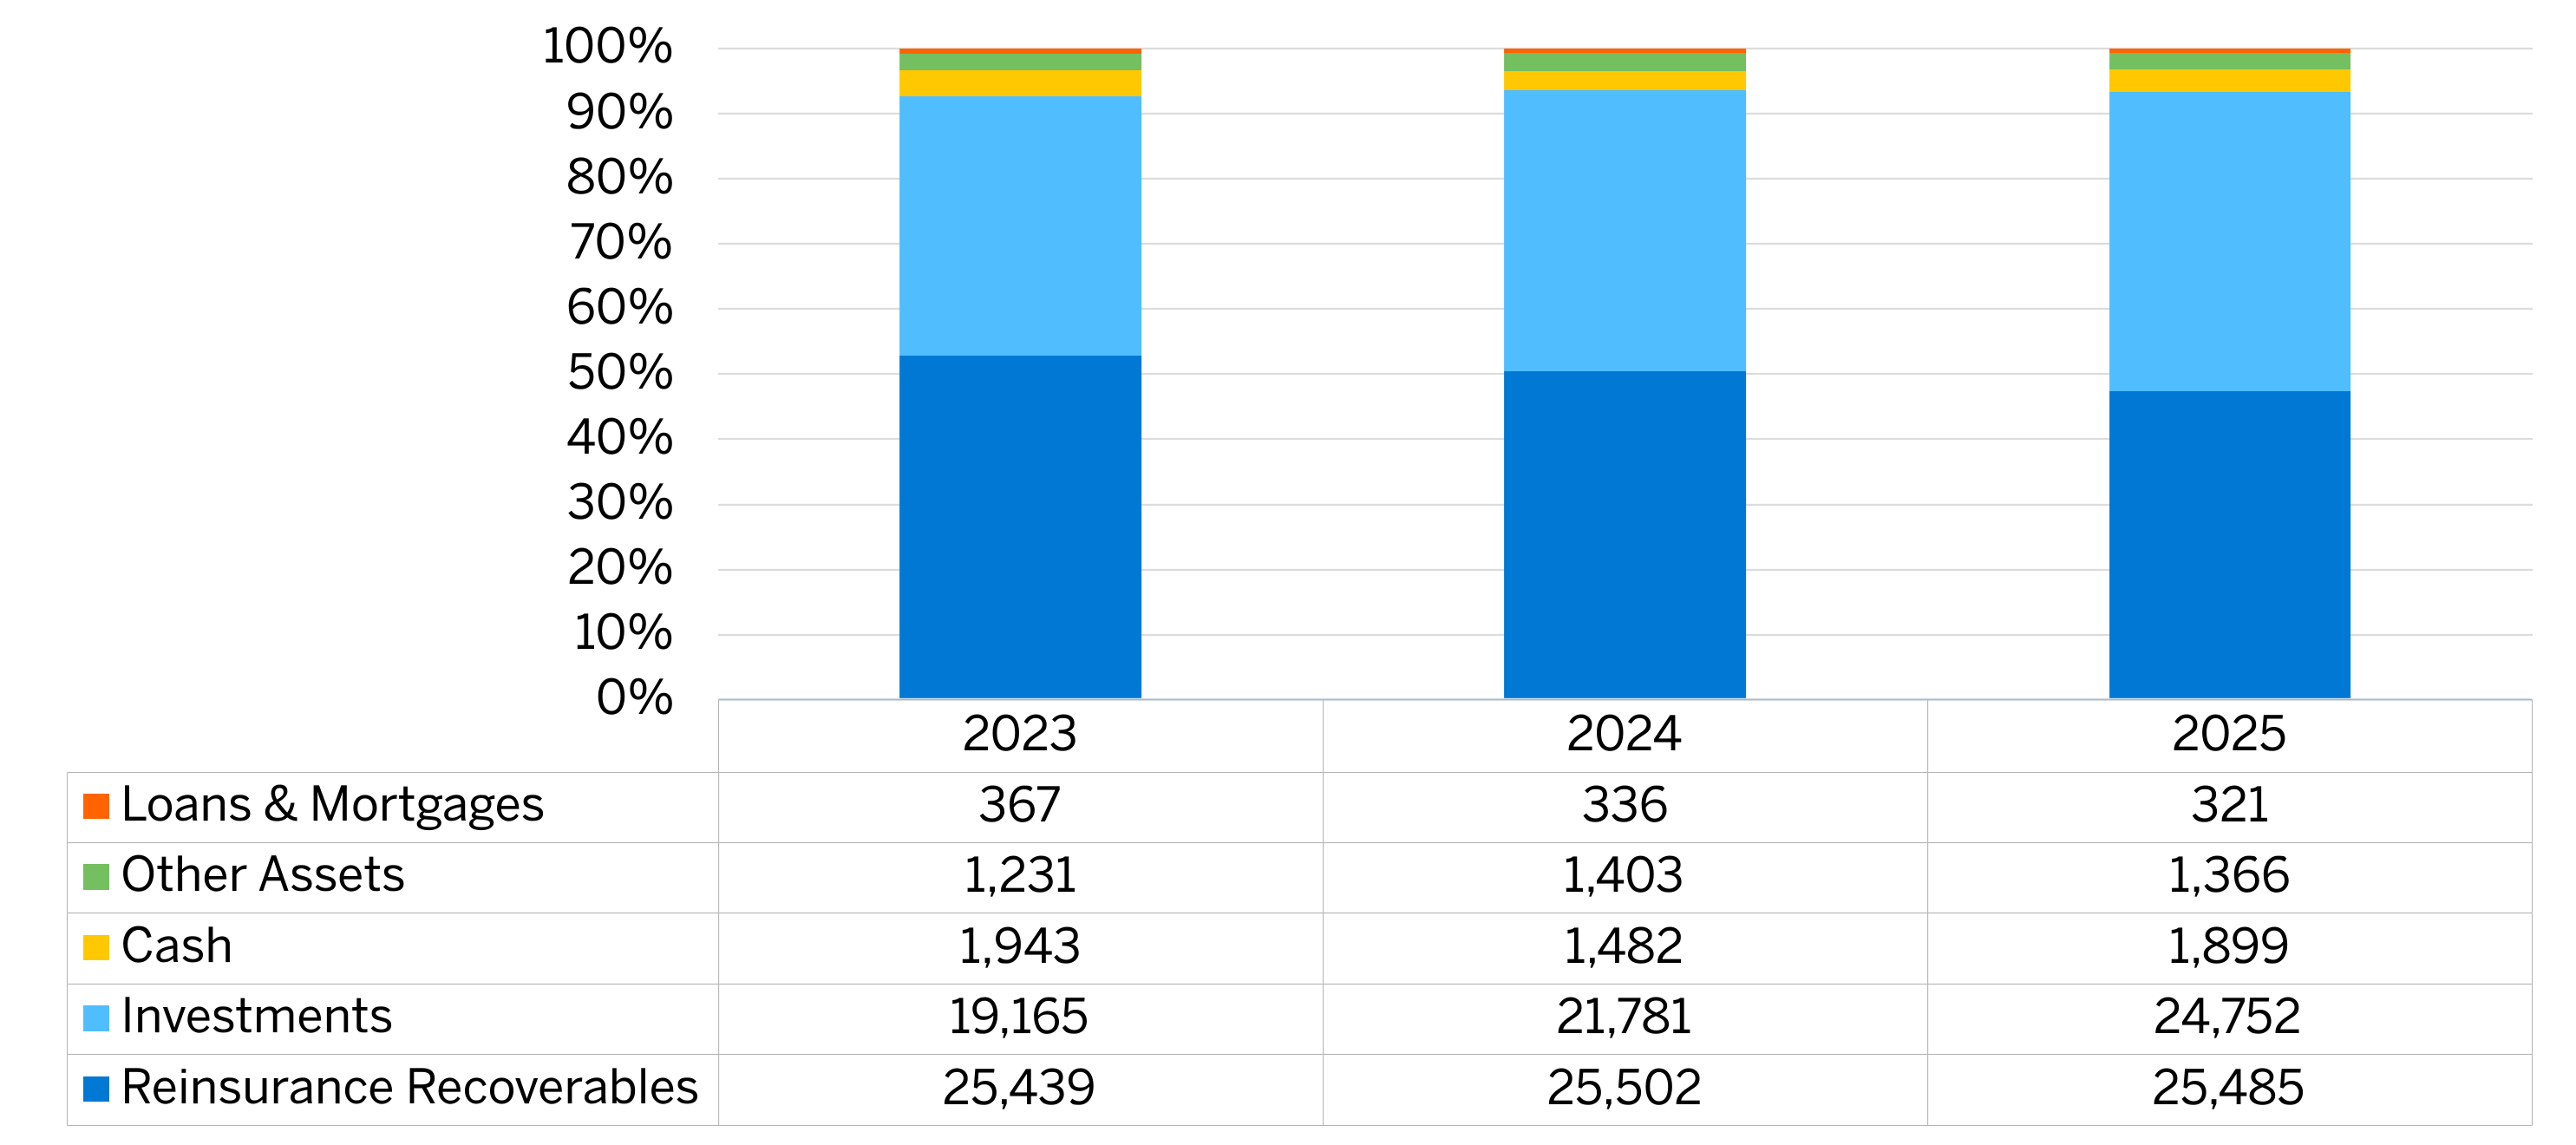
Investments reached €24.8 billion, up 14%. Government and corporate bonds remained dominant at 74% of investments, supporting duration matching and stable income; collective investment undertakings (CIUs) accounted for 16%. The high share of recoverables—approximately 47% of non-UL assets—remains a defining balance sheet feature.
Eligible own funds
EOF increased by 9% to €7 billion, slightly faster than the 8% rise in the aggregate Solvency Capital Requirement (SCR). Capital quality remained strong: 86% of EOF was Tier 1. Eleven insurers held Tier 2 capital; BPCE and Cardif were the only entities with Tier 3 capital. Foyer and La Luxembourgeoise stood apart, with own funds equal to approximately 22% of assets.
Solvency position of life insurers in Luxembourg
The sample's aggregate solvency ratio increased from 160% to 162%. Most insurers reported ratios between 145% and 200%, with outcomes ranging from 141% for The OneLife to 227% for Foyer. Overall, the sample maintained an adequate, though moderate, buffer above the 100% requirement, while solvency levels and year-on-year movements varied materially across insurers.
Figure 3: Solvency ratio of the selected insurers
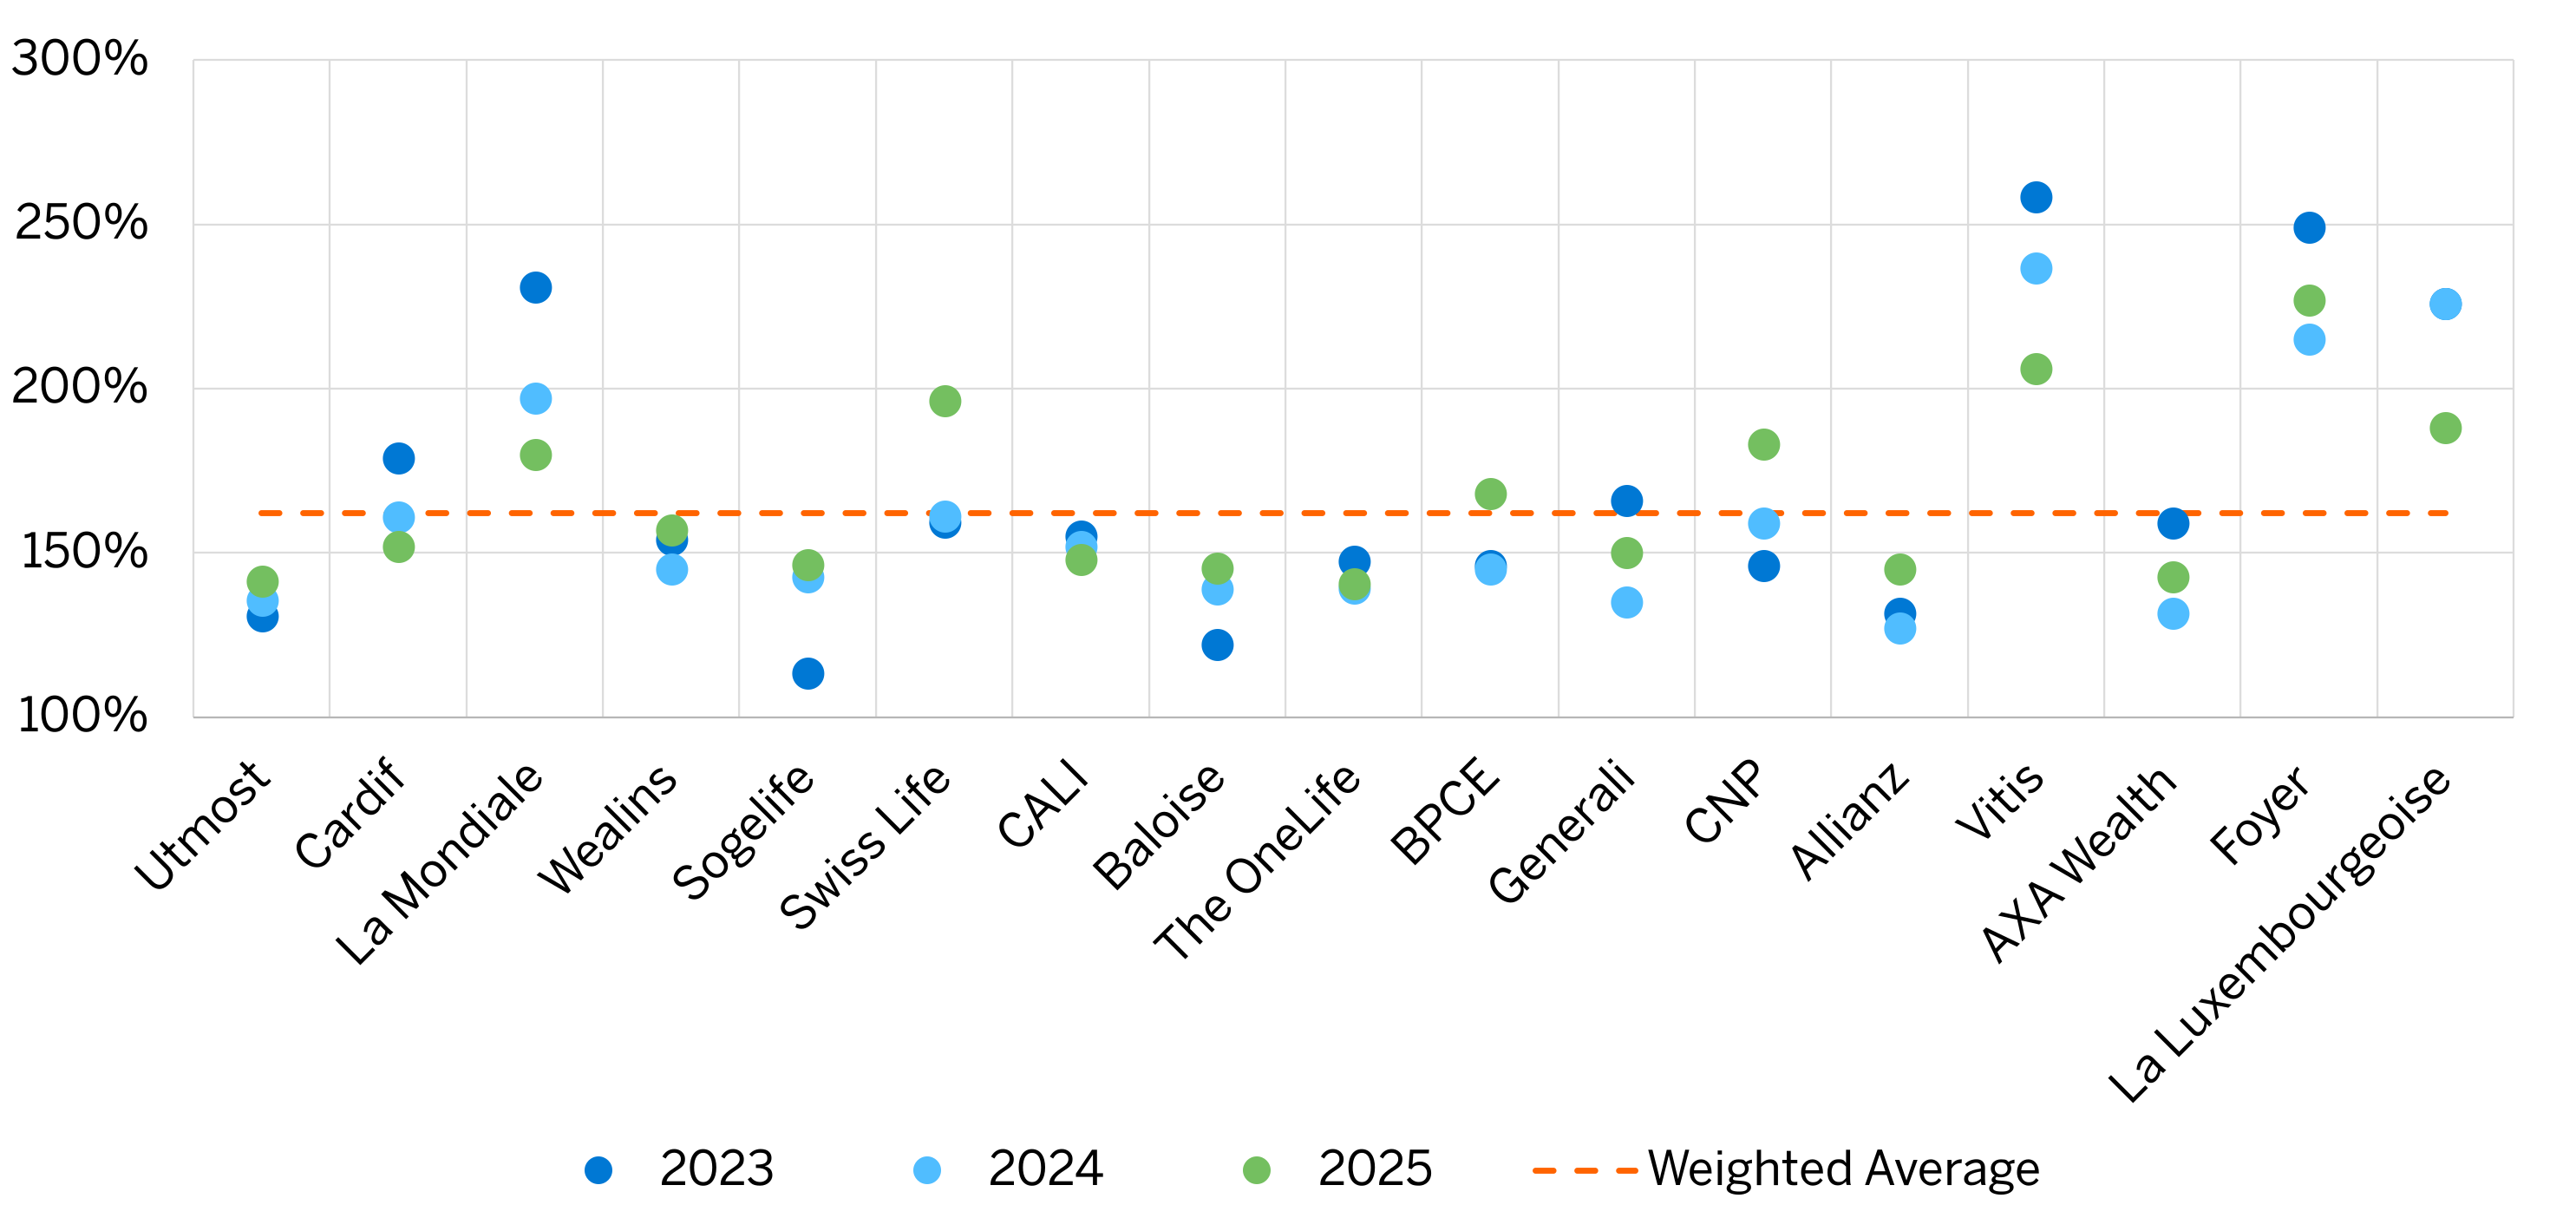
Swiss Life recorded the largest increase, from 161% to 196%, supported by a new mass-lapse reinsurance treaty, lower life underwriting risk and favourable economic developments. La Luxembourgeoise fell from 226% to 188% as market risk increased and the loss-absorbing capacity of technical provisions (LACTP) decreased. Vitis declined from 237% to 206% because new business increased the SCR faster than EOF.
The largest increases in own funds were recorded by Utmost, Wealins, Foyer and CALI. The underlying drivers differed: reconciliation reserves at Utmost; 2025 earnings at Wealins and Foyer; and subordinated debt plus a higher value of in-force business at CALI.
Risk profile and volatility adjustment
Market risk and life underwriting risk were the dominant Standard Formula components. Before offsets, market, default and life risks represented approximately 151%, 4% and 88% of the SCR, respectively. Diversification reduced the total by 46 percentage points; loss-absorbing capacity of deferred taxes (LACDT) and LACTP reduced it by a further 19 and 87 percentage points, respectively.
Figure 4: Breakdown of SCR of the selected insurers using the Standard Formula per year-end 2025
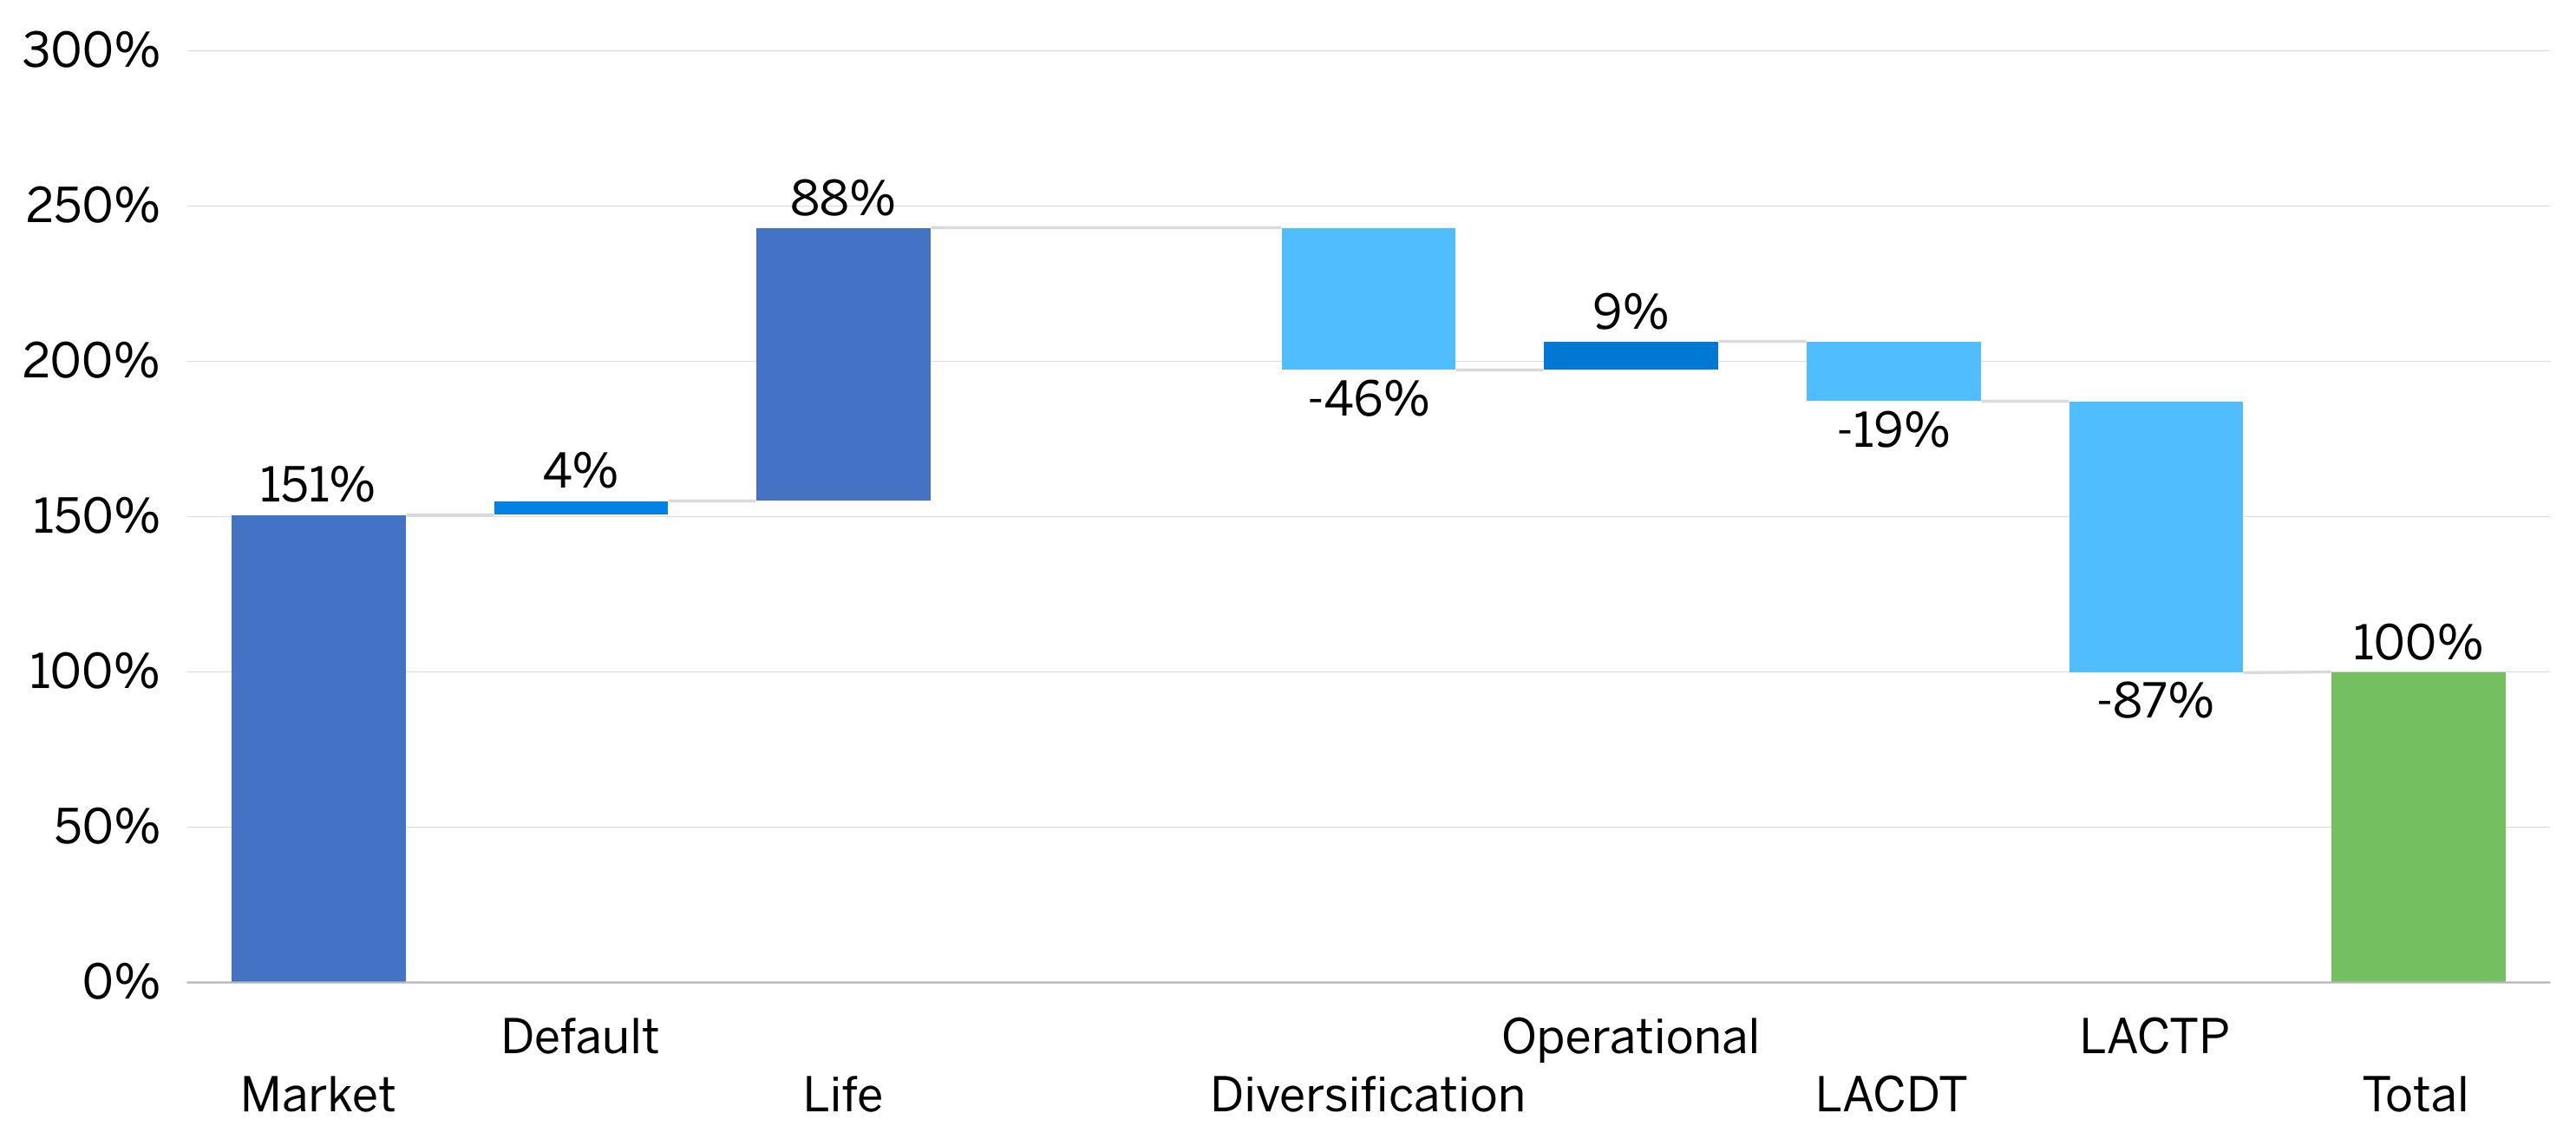
The scale of LACTP is particularly important: It is a major source of capital relief and helps explain differences in solvency movements. LACDT averaged 19% of SCR, below Luxembourg City's 23.87% effective corporate tax rate, and was generally no higher than reported deferred tax liabilities (DTLs). In addition to these loss-absorbing mechanisms, the volatility adjustment (VA) provides a further, although more limited, source of support to solvency ratios.
The average benefit of the VA fell to 1.4 percentage points in 2025 as the euro VA declined from 23 to 14 basis points. For most reporting insurers, applying the VA improved the solvency ratio by 0.2 to 9 percentage points. Its aggregate effect was therefore modest, although still meaningful, for selected entities.
Premium momentum
Sample GWP reached €30.2 billion, up 17% and approximately 97% of Luxembourg life GWP. IL & UL products accounted for 75%, and life with profit participation for 24%. Growth was broad-based but strongest outside the European Economic Area (EEA); CNP, Foyer and La Luxembourgeoise remained the only insurers deriving more than half of GWP from traditional business.
What’s next for luxembourg’s life insurers?
Milliman has supported several companies with the analysis of the LACDT position, opportunities to reduce market risk for UL and traditional business, and improvements to overall financial and risk organisation and processes.
The Solvency II 2020 review introduces key changes that will become effective early 2027, including a new approach to interest rate extrapolation, a lower cost of capital for risk margin calculations and stricter calibration of interest rate risk with negative rate scenarios. The VA becomes less volatile and more tailored to insurer mismatches, long-term equity rules are enhanced, and Pillar 3 disclosures are streamlined. Insurers will need to adapt their reporting and model landscape and revise their governance, policies and operational processes to align with these requirements.
Milliman has developed an interactive application to efficiently compare the metrics of insurers as disclosed in their QRTs. If you want to learn more, or receive free access to the tool, please follow the link https://apps.nl.milliman.com/lu/life or send an email to [email protected].
If you have any questions or comments on the information above or want to discuss further capital management solutions for life insurers, please contact your usual Milliman consultant.